Saturday, December 25, 2010

Market Direction: Technical Point of View

Its a long time since I did a study on purely technical analysis.Now, is a good time to focus on pure Technicals. Lets have a glance at e few charts below.

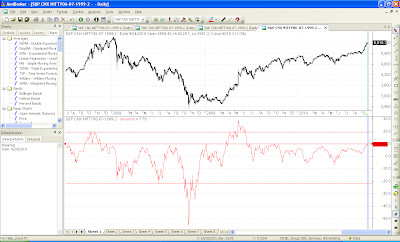
1. Lets look at at an indicator which Shail and I have did a study of. Its the difference between 5 DMA and 20 DMA of the Nifty. Right now it is in positive territory and touching the resistance line of the previous peaks. Any close above 6025 and this trend line gets broken upwards. A clear breakout.


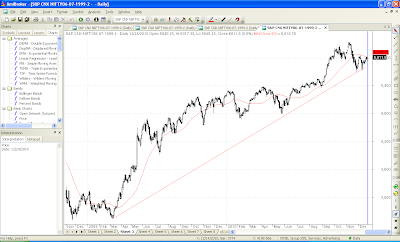
2. The 50 DMA is at 6018. Have a look at the past record. Whenever it has been broken on the upside or downside, there has been a substantial move. This is the first time since the rally started in March 2009 that it is trying to make an up move after being resisted once. So, if we move convincingly above 6018, up we go else we are in for a major correction.


3. There is a cluster of supports around 5950. The 20 EMA, 50 EMA, 5 day low Ema. This values should be kept as strict stop losses on the lower side.


4. The Bollinger Band indicates a resistance around 6067 which was the previous top. This rally has been very slow and retracement has taken a longer time than the fall. All this makes the rally suspect.


5. In case of a fall, Gann fans indicate support around 5600 and resistance around 6600.


6. Considering Fibonacci levels, the resistances should be at 6047, 6070, 6106, 6215. Beyond 6215 we are going for new highs.

7. The daily stochs have given a sell signal. These are leading indicators. The correction can be up to 5950 or deeper levels.


Strategy in a nut shell, long above 6024 and short below 5950 levels. In between, just watch the fun.

Sunday, December 19, 2010

Its Vacation Time

This was a truncated week for the markets. The Nifty moved up by 1.6 pc, the FIIs remained net sellers and there are expectations of no major moves in the holiday season. But, stock markets are known to surprise and we never know what is in store. Lets examine the fundamental and technical factors at play here.

1. On the Domestic front, the the 2G scam got murkier, the CBI made a show of taking action.What could queer the pitch if A Raja actually gets arrested next week. There are 2 possibilities if this arrest is made. One is DMK drops Raja like a hot potato and life goes on. I feel this is more likely because elections in Tamil Nadu are just round the corner in May 2011, and the DMK needs the Congress as much as the Congress needs it.Breaking the alliance would immediately reduce DMK to a minority government at the State level and a hostile Jayalalita is waiting in the wings. On the other hand, if the DMK withdraws support the markets will go for a toss.
2. Industry leaders like Deepak Parekh and Rata Tata have openly come out and voiced concern over the phone tapping.This is the first time, that senior industry voices have raised their voices against government policy. This only underscores the seriousness of the issues in debate. The FIIs are only concerned on the return of their investments. As recent data has shown they may withdraw the capital at the slightest whiff of trouble.
3. The Korean peninsula is the joker in the pack. North Korea has issued an open ultimatum to S. Korea,, that if they go ahead with the war games, there would retaliatory attacks. One never knows where this will all end in.
4. Europe remains in a state of flux. The Spanish bond yield in comparison to the German bond yield, the spreads have widened. These spreads are usually the first indication of trouble.
5. The advance tax numbers have been good, but that is history now. Crude oil has been consistently trading in the 85-90 dollars band. 100 dollar crude is now a reality. The harsh winter in Europe will not help cooling down crude prices either.This will lead to further fuel price hikes, spiraling inflation and rate hikes by the RBI.
6. The spate of lending rate hikes and hike in the fixed deposit rates are a sure sign that the rate hikes by the government are beginning to hurt the Banks bottom line.
7. Nifty Open Interest shows strong support at 5800 and strong resistance at 6000. I would watch the 6000 levels very closely as above that, a fresh leg of up move is on the cards. Short below 5875 and long above 6000.
8. I am bullish on gold, crude, government FPOs and bearish on banks, automobiles.

To sum it up, expect range bound movement, a big fall in case of unexpected news and the action to be played out in Jan. The selling by FIIs caps the upside. Decembers have been generally positive months for the markets over the past so many years. The year end bonuses are decided on the NAV values.

Friday, December 17, 2010

Risk Management and Investing

I had written a guest post for Subhankar.

In this month’s guest post, Nishit covers the related topic of Risk Management. Properly assessing and understanding the risks involved in one’s investment plan and taking appropriate steps to mitigate those risks helps in formulating a proper asset allocation plan to suit one’s individual investment style and risk tolerance level.

-------------------------------------------------------------------------------------------------------------

One of the most important topics that every person who makes any investments should be aware of is Risk Management. A good investor who is poor at Risk Management can get wiped out. Let us try to define risk and risk management
http://investmentsfordummieslikeme.blogspot.com/2010/12/risk-management-in-investing-guest-post.html

Saturday, December 11, 2010

Uncertain Times in December

This was a roller coaster week for the markets and the markets lost 2.3% of the index value. There were certain takeaways for each of us, which if adhered will save us a lot of money if not make money. Lets examine the key events for the markets.

1. FIIs were net sellers each day of the week. The selling intensified as the week went by and at the end of the week they had dumped almost 1 billion dollars worth of stocks.

2. Even though the Indices declined only 2.3%, the broader market was butchered. Have a look at today's Economic Times and see the number of stocks hitting 52 week lows as compared to hitting 52 week highs. Broader markets are usually leading indicators.

3. Gold is sustaining on a closing basis near its all time highs. That means people's perception of risk has increased. It could also mean those people who know are buying gold as a hedge. Europe remains a wild card and we do not which economy will need a bailout next.

4. FIIs always hedge in the Futures and Options market. So, they make money even if market is falling. They may well retain their equity holdings, make small paper losses here but make handsome profits on their derivative trades. remember its the money which counts.

5. The political storm is intensifying with new cockroaches coming out everyday. The Telecom scam may well take Manmohan Singh with it. It may sound ludicrous now but the government needs to regain the moral high ground.Manmohan Singh has enjoyed power for 6.5 years and made a place for himself in history. Exit Manmohan enter Pranab?

6. The Technicals are badly shattered. Next support for me, looks to me 200 EMA at about 5560.

7. If we take Elliot and wave 1 was from 6339-5690 = 649 points. Wave 2 from 5690 -6070 = 380 points. Looking at this, the targets for Wave 3 could be 5421, 5096, 5020. We may be about enter wave 3 of 3, the most dreaded wave with a devastating gap down also possible.

Its the time to focus on preservation of capital. Gilt funds, gold, bank FDs are what I would look at now.I would also keep cash in hand to invest in blue chips at lower levels.
A close above 6000 levels in Nifty and we are again moving up.

Sunday, December 5, 2010

Posts from Shail

I am happy to say that Shail will posting as and when his schedule permits him to post. Shail, is one of the technical analysts whom I greatly admire for his out of the box thinking. I again ventured into TA with Shail's help. Lets enjoy his posts.

INR movement v/s Indian Equity


The two charts shown above illustrates the correlation between INR and S&P CNX Nifty from jan 2007 onwards, this clearly indicates that stronger rupee shows bullish sentiments of FII, although now DII also contributes significantly, in to Indian capital market.


The bar chart below shows the net FII inflow in Indian capital markets in the same period which partly explains the stronger or weaker rupee in the period of study. Although the value of rupee depends on many factors including Global currency trends, Oil prices as India is a big importer of petroleum, RBI policies and off course political factors this study mainly deals the change in rupee with respect to FII movements.

FII have started selling in huge quantities starting nov 2007 till October 2008 thus contributing to the weaker rupee. Technically rupee has strong support at around 44 levels this may indicates that net FII inflows are capped and at 44 levels FII out flow dominates the inflow. Same is visible in the chart above during April – may 2010 and Nov-2010.

We can conclude that the market rises with increase in FII inflows it could be long term or short term, This helps in stronger rupee even when the GDP is not so strong like the case in 2008, but this also means that if no FII flows coming in then the markets may have already made a top or some more correction before they make a new top.

Saturday, December 4, 2010

Wikileaks: Impacts and significance

This week the world was rocked by the Wiki leaks expose of American Diplomatic cables by the now now (in) famous Wiki leaks expose. What is wiki leaks and what is its significance?

To skip re-inventing the wheel, have a look at the wiki site below:
http://en.wikipedia.org/wiki/Julian_Assange

Now, lets see the ramifications. In the short term, the expose of the diplomatic cables and confidential information being shared in the public domain is just a small event making headlines. The basic gist was the expose of US secret moves and name calling of its allies. The French President was called as the Emperor with no Clothes. All these revelations in the short term offer nothing much except provided entertainment for billions of bored readers worldwide.
The real ramifications lie in the long term perspective. The only strength the US has its dollar and its numero uno status in the pecking order worldwide. Such damaging comments about its double standards with its allies will lead to an erosion of trust amongst its allies. The shift will be gradual not visible in a day, month or an hour. Often, small seemingly insignificant events lead to big catastrophes.
The assassination of Archduke Ferdinand lead to the first world war.

http://en.wikipedia.org/wiki/Assassination_of_Archduke_Franz_Ferdinand

That event was not the main cause. The ground work was laid years in advance. It was a small match which lit the bonfire which consumed the world.

The disquiet amongst its allies may eventually lead to the dollar not being the Numero Uno currency in the world. This may be next month, next year or next decade for all we know.

The wiki leaks are significant in the sense they can be the beginning of the end of the American dream. Each nation usually leads the world for a century or two. First it was the British, then the Americans after the World War 2, now we await the rise of the new axis of powers.

Us has to adjust to the new world reality that they are not the first nation of the world but first amongst equals. If they string together an alliance of allies they can cling on for few more decades. The writing is on the wall. Its up to the US to read it.

The Korean exchanges, the Iranian Nuclear stuff can all be just small events in a cycle unfolding which leads to a new world order.

Julian Assange is both a hero and a villain. Hero for making the information public. Information is the right of every world citizen. Villain for making statecraft secrets public. History will judge Julian Assange. It is also said History is written by the Victors.

Thursday, December 2, 2010

Introduction to Options - Part 1

Options are one of the most lucrative ways of making money in the markets. The flip side is that they can lead to huge losses if not dealt with correctly. Let us explore the world of options. To begin with there are 2 type of Options, Put option and a Call Option. Put Option gives the buyer to sell a stock or index at a particular strike. It gives the buyer the right to sell at a particular strike price but not the obligation to sell. It is similar to taking insurance on your house or car. Buying a call option gives the buyer the right to buy a stock or index at a particular price but not the obligation to buy the underlying. It is similar to giving a deposit amount to buy a house at a particular price.
Options are of 2 flavors. The American Options and the European options. The European Options can be exercised only on expiry day whereas the American options can be exercised on any day till expiry. In plain English, it means though you can buy sell these options every day as per market price of options, the actual difference between market price and strike price can be got only on expiry day for European Options and any day till expiry for American Options
Example:
1. Nifty 6000 CE Nov 26 is trading at 70 rupees and the underlying index is at 5950 with 10 days to expiry (Strike price 6000, Call Option, Flavor European)
What this means is I believe the Nifty will go much higher in the next 10 days and will expire say at 6200. On the day of expiry I will get 6200-6000 = 200 rupees. My net profit on the trade is 200-70 = 130 rupees. Now, let us assume the market falls to 5800 instead of going up. I will end up only losing the premium I paid.

2. Nifty 6000 PE Nov 26 is trading at 70 and the underlying index is at 6050 with 10 days to expiry
What this means is that I believe that Nifty will go down in the next 10 days and will expire say at 5800. On the day of expiry I will get 6000-5800 = 200 rupees if the Nifty expires at 5800. My profit is 200-70 = 130. Now, if against my expectations if the markets move up and expire above 6000, I end up losing only the premium paid.

Now, we have learnt what options are. There are 4 possible things one can do with Options.
1. Buy a Call Option
2. Sell a Call Option
3. Buy a Put Option
4. Sell a Put Option
What does all this mean? Buying a Call or Put Option means that we have the right to buy or sell an underlying stock or index at a particular strike price. The loss is limited to the amount of premium paid. Selling a put or call option means we are open to facing unlimited losses or profit if the market moves opposite to our direction.
1. Nifty 6000 CE Nov 26 is trading at 70 rupees and the underlying index is at 5950 with 10 days to expiry.
Now, I sell the 6000 CE option as I believe the markets will move down. So, if the expiry is below 6000, I pocket the entire 70 bucks premium. If my direction goes wrong and market moves to 6500, I have to pay 6500-6000 = 500 rupees to the option buyer. My net loss is 500-70 = 430 rupees

2. Nifty 6000 PE Nov 26 is trading at 70 and the underlying index is at 6050 with 10 days to expiry
I sell the Put Option because I believe the markets will go higher in the next 10 days. If they expire above 6000, I pocket the entire 70 rupees premium. If my direction goes wrong and market crash to 5500, I have to pay 6000-5500 = 500 rupees to the buyer. My net loss is 500- 70 = 430 rupees.

From the above examples, we can see buying options, the loss is limited and profit is unlimited. Selling options, profit is limited and the loss is unlimited. Yet, it is more lucrative to sell options rather than buy options. Why is this so? Let us look at this in my next post. I plan to write a series of posts every month which would take us from the basics of options trading to complex strategies.

Sunday, November 28, 2010

Worry Clouds on the Horizon: The Big Picture

Over the last few weeks, several events which have occurred which are a reason to ponder over if not outright worry. Fundamentals do not change overnight but are a work in progress and suddenly one day the symptoms become apparent to all and the trend changes. The build up to such a trend change takes a long time.

Global factors:
1. The US came up with the QE-2 program of pumping in 600 billion dollars. This just confirmed the worst fears that the US dollar will be toilet paper sooner or later. Aything in excess is bad and excess dollar printing debases the value of the dollar. The only thing holding up the dollar is its safe have status. It just needs 1 event to trigger panic and have the world lose faith in the dollar. The event could be anything, war, economic collapse, trade wars.
2. Gold is the only safe haven. QE-2 demonstrates that. The price of gold has accordingly behaved the same. It has stayed above its previous peak of 1280 dollars for quite a few weeks.
3. Europe is in a bigger mess. Greece is gone, Ireland is gone. Portugal will be next and then Spain. As the economies get bigger, the bailouts will extract a bigger price. Spain bailout may well test the future of the Euro. Countries like Germany simply cannot continue to enjoy the advantage of a weak euro aiding their exports and not take the pain of supporting the weaker economies.
4. Japan is already talking of currency wars as their strong Yen is hurting their exports. China with its weak Yuan policy is already adding fuel to the fire.
5. Conflicts like the Korean are just small blips on the horizon. A conflict will hurt all parties concerned. Its mere shadow boxing. If it goes out of control, then we have a problem on the hands.

So far, the global crisis was a selling point for the Indian story of growth and 9 pc GDP. Over the last few weeks, the series of corruption crisis have severely dented Manmohan Singh's credibility.
Local:
1. The 2 G scam siphoned off huge sums of money from the Nation. What is even more worrying is the brazenness of those involved. The JPC probe demand is justified and necessary. JPC is answerable only to the Parliament and can summon even the PM. If the Congress has nothing to hide, why create such a row over JPC.
2.Adarsh scam has indicted the defense establishment. The judges of Allahabad High COurt are also under scrutiny. So far, it was an established fact, that politicians are corrupt, now the malaise is spreading to the pillars of the Indian society.
3. These events do not have an immediate impact. They have a domino effect and one day the Dominos fall.Already, Transparency International has lowered India's rating by 6 places. TI is a world renowned anti-corruption watch dog.Many MNCs base their decision to invest in a country on these ratings.
4. Victory of Nitish Kumar and its margin suggests the electorate supports good governance. Gujarat is also one more example of good governance. 9 pc GDP growth cannot be taken for granted. As I see, Congress may well lose the 2014 elections. Remember in 2004, Congress was written off. Similarly, history could repeat itself and NDA may well make a comeback with a reduced role for the BJP.
5. The FIIs have just withdrawn 4000 crores, less than a billion dollars and the markets have fallen 9 pc. This doesn't speak much of the depth of Indian markets. If FII selling intensifies, markets will just collapse. What is especially worrying is how midcaps have just collapsed. HCC from a peak of Rs 81 to Rs 40, loss of 50 pc and several more companies have fallen similarly. Just open Economic Times to see the number of companies making 52 week lows.
6. This butchering of the midcaps is what sets this correction apart from other corrections since Mar'09.
7. We may well have 1 more round of up move left. Caution bells are ringing loud and clear. Its time to take profits off the table, and also invest only in blue chips if you must.
Bullish scenario:
Bull markets end with a big bang. Remember Jan 2000 and Jan 2008. This time the fall is channeled, so just a correction.
Bearish scenario:
Sentiment has gone bad. Mid caps slammed. This normally doesn't happen in simple corrections.

Sunday, November 21, 2010

Expect a bounce ahead

It was a week of losses at Dalal Street but are things as bad they seem to be? Let us try and explore.

1. The markets lost about 3 pc to close at 5888.DIIs bought worth 865 crores and the FIIs bought worth 32 crores. Now, this can be interpreted in 2 ways. Markets fell in spite of 2 pillars not selling indicating shallow market. Else, it was operator driven selling.

2. We have trend line supports at 5803, 5830. These are very important supports as breaking this we enter the previous channel and 1 trend line is line joining lows from March 2009.


3. 5960 becomes a very key level as 5 week low ema and 5 day low ema is around this point.


4. The Bollinger band has touched the lower line after touching the upper band implying a bounce is possible anytime soon.


5. Ireland crisis seems to be over, 2G is settling down. Even if we have hit the top, expect a corrective upmove to 6045, 6101, 6156.

Corrections are part and parcel of trading. One should follow the trend for trading. We are near key supports and expect at least corrective bounces any time. We have now fallen for about 9 sessions and usually all falls are for 8-11 sessions.

Saturday, November 13, 2010

How has November been historically for the Markets?


November has been a positive month for equity markets. The high has always been in positive terms. Max of 15 pc, min 2 pc and average of 8.8 pc. This gives us probable targets of (6920, 6139 and 6547)
The low points have varied from -13 pc to 0.21 pc. We can exclude -13 pc because we were in the midst of a bear market. Average has -2.8 pc giving us a potential low of 5845.
The close has been positive 8 times out of 10. Average close has 5.6 % higher than October. This gives us a target of 6355.
So now we have a potential low of 5845, high ranging from (6139, 6547, 6920) and a potential close of 6355.
It is a buy on dips market totally. Most money is made or lost in the last leg of bull market. Euphoria is needed for bull market to end. Coal India and Obama may give this much needed last fast rally.
The Bollinger Bands on a weekly basis give us a target of 6420.


The monthly Bollinger band gives us an overbought picture last seen in Jan 2008. This gives us the possibility of a crash sooner or later.


Based on current evidence at disposal, recommendation is to be long with trailing stop losses as given in Daily Levels. Also, no writing of puts. Either buy calls or write calls.
Targets of 6422, 6547, 6920 are on the cards. On the lower side, 5540, 6017, 6142 are stop losses for longs.

I had done this analysis last week but forgotten to upload it. Taking this week into factor, keep 6000 as key level.Below 6000 down we go.

Thursday, November 4, 2010

Diwali Picks 2010

It is that time of the year.New Mahurat, new beginnings. Have a look at this year's prediction and may each one have a wonderful year ahead.

Thank you Lakshmi and Lalita without whose tireless efforts, this presentation would not have been possible.

The Technicals are by Lakshmi. She is one of the finest Technical Analysts I know.

The link to her blog is http://vipreetinvestments.blogspot.com

The presentation can be accessed below:

https://sites.google.com/site/moneymanthanfiles/diwali-picks-2010

Wednesday, November 3, 2010

All Indicators in buy mode

I did not take get time to upload charts but all my indicators are firmly in buy mode. A strategy could be buy 6300 call and 6000 puts and see how it goes tomorrow.

US Elections: Mixed Signals

Contrary to the expectations, the Democrats have not been trashed as badly as expected.Holding on to the Senate is a major face saver for Obama.
Mid-term elections are just a milestone onto re-election 2012. The present results may mean that QE-2 is just a damp squib. The probabilities increase of a lower QE-2.

If before elections it was 80 % in favor of big bang and 20 pc in favor of less, now its 60-40.( 60 pc big bang, 40 pc small amount)

Technicals indicate upmove. Keep watching for updates as we go.

Saturday, October 30, 2010

Diwali Fireworks: Explosive Week Ahead

Its Diwali Time and it is going to be a explosive week ahead, most probably the most explosive week of the year. There are several reasons and I am going to list them one by one. This definitely merits both a fundamental and technical analysis. The Technical Analysis will follow in a day or two.
Fundamentals:

1. RBI Meet on rate hikes on Tuesday, November 2. The Bank is expected to hike rates by 25 basis points. Liquidity is presently tight because of Coal India IPO, but that situation will ease by Monday when the allotment occurs.

2. The Fed Meet on Nov 2-3. The timing is a joke played on all of us. US goes to polls on November 2nd and the Fed will meet after the result is out. The US has a Senate and a House of Representatives. Currently, the Democrats control both and the Presidency. It is expected that the Republicans will wrest control of both. What does this imply? A gridlock ahead. The 2 houses can veto anything which the President suggests in policy terms and the President can veto the House policies.
The Quantitative easing which the market is expected to be at least in a range of 1000 billion dollars. If it is below market expectations, expect big time tanking.

3. For India, it implies that if dollars are pumped in, markets rise as liquidity gushes. Gold will climb and we will have a big rally taking the indices to new life-time rallies. If no easing, then gold will fall 4-5 %, the markets will tank. Lower circuit is not ruled out. Such events need to be handled carefully.

4. Coal India lists on Thursday, 4th November. FIIs have pumped in huge amounts of money. This is first big ticket IPO where the FIIs had to put in 100 pc money. Earlier was 10 pc of bid amount. Much of the money is from new FIIs which will find itself into index stocks, if the Fed policy comes in favor. So, the money is there.

5. Obama is visiting India and expect a positive buzz of sentiments. There would be a slew of feel good announcements and could lead to euphoria.

2 Scenarios: Positive Fed policy, plus cash from coal India IPO plus big ticket announcements = Upper circuit or a very big rally on the Indices could be 600-700 nifty or 2000 sensex points in a blink.

Negative Fed policy, flight of capital leads to big fall.

Applying human psychology, Fed will take easier stand, delay the problem. Give liquidity boost, let dollar be a toilet paper after 2-3 years, and let next Fed Chief and US President handle the bigger mess. This may be the last chance for US to rein in printing of dollars else its doomed to failure in the long run. This is the Consumer age, we live for the present, in the long run we all are dead. That is the motto. This makes Gold particularly attractive after a dip last week.

One simple logic as Frank Templeton, bull markets die in euphoria, that final kick is missing yet. Where everything is out of control. Maybe this is the week.

The Technical Viewpoint will follow.

ps: Many blogs are giving out Trojan signals when you run your anti-virus. Does anyone have a solution for this?

Sunday, October 24, 2010

TCS Results Rock

Very rarely do quarterly results of companies get me excited. I consider them as mere milestones on a journey. Milestones to which undue importance need not be attached. Poor or great results over a quarter or two are not earth shattering news except for the pink papers and news channels. TCS results are one which made me sit up and take notice. Why?
Here is why? They added almost 20000 employees in 1 quarter. They had double digit growth in all Verticals. Their profit margins were almost 30 pc and gap between Infosys and TCS is just 2.2 pc in terms of EBITDA margins. They became the first Indian IT company to login a turnover of 2 billion dollars in a quarter. They added 19 new large clients in first half of the year as compared to Infosys 9 clients.
The elephant has woken and begun to run. Infosys earlier had a large premium in valuations compared to TCS no more now. The Market cap of TCS has already overtaken Infosys. In P/E terms also the gap is narrowing.
When we compare Infosys, TCS and Wipro, Wipro seems to have lost its way, Infosys the management seems to be in consolidation mode.
I happened to see the management of TCS on CNBC and their body language impressed me. They indicated they are willing to do whatever it takes to grow. A calm, composed, confident management team. The transition has been smooth from Ramadorai to the next generation.
TCS expected EPS is 45 bucks for FY11, at around 25 times P/E not exactly cheap.But this is now a SIP stock. Buy 5 shares every month say for next 5 years.
In the long run, only the big IT companies will survive, the smaller ones will get merged and eaten up by the larger ones.

Sunday, October 17, 2010

Happy Dussehra

Wish all of you Happy Dussehra.

Here are some of the legends behind Dussehra.

In the months of Ashwin and kartik, Hindus observe a 10 day ceremony of fast, rituals, celebrations, fiests to honor the mother Goddess and triumph of Lord Rama over Demon Ravana. Dussehra also symbolizes the triumph of warrior Goddess Durga over the buffalo demon, Mahishasura. Thus, it is a celebration of victory of good over evil.

This celebration starts from Navratri and ends with the tenth day festival of “Dussehra”. Navratri and Dussehra is celebrated throughout the country at the same time, with varying rituals, but with great enthusiasm and energy as it marks the end of scorching summer and the start of winter season.

The tenth day after Navratri is called Dussehra, on which number of fairs are organized throughout the northern India, burning effigies of Ravana.It is also called “Vijayadashmi” as this day marks the victory of Lord Rama over Ravana. VijayaDashami is considered to be an auspicious day for the Indian householder, on which he worships, protects and preserves 'Shakti' (power). According to Scriptures, by worshipping the 'Shakti' on these nine-days the householders attain the threefold power i.e. physical, mental and spiritual, which helps him to progress in life without any difficulty.

The 'Ramlila' - an enactment of the life of Lord Rama, is held during the nine days preceding Dussehra. On the tenth day (Dussehra or Vijay Dasami), larger than life effigies of Ravana, his son and brother - Meghnadh and Kumbhakarna are set to fire.

The theatrical enactment of this dramatic encounter is held throughout the country in which every section of people participates enthusiastically.

In burning the effigies the people are asked to burn the evil within them, and thus follow the path of truth and goodness, bearing in mind the instance of Ravana, who despite all his might and majesty was destroyed for his evil ways.

Legends

Dussehra is also known as Vijaya Dasami, because of the victory of Ram over Ravana. On this day in Satya Yug, Ram (the eighth incarnation of Lord Vishnu), killed the great demon and king of Lanka, Ravana.

Puranas also opined that in this day warrior Goddess Durga defeated and killed the buffalo demon Mahishasura.

* Victory of Rama over Ravana:


Rama was the eldest son of King Dasarath who was the ruler of Ayodhya. When Lord Rama was going to be crowned as the next King, Queen Kaikayee persuaded the king to crown Bharat as the next king and to send Rama on an exile for 14 years. On his exile Rama was accompanied by his brother Lakshman and wife Sita.

A demoness Soorpanakha got fascinated with the charm of Lord Rama and wanted to marry him, for which she threatened to kill Sita. Agitated with this, Lakshman cut her nose. Knowing about what happened to his sister; Demon Ravana wanted to take revenge and in turn abducted Sita. Lord Rama, along with Lakshman and Hanuman, fought a battle against Ravana and emerged victorious in rescuing his wife Sita.

* Victory of Durga over Mahishasur:


The demon Mahishasur, was given a boon by the fir God (Agni), according to which, any weapon that had a masculine name couldn’t do anything to harm him. Taking the advantage of this boon, he caused immense destruction and hatred. The gods were very tensed and worried about this fact; they consulted Lord Vishnu over it, who advised them to invoke Goddess Shakti. With God’s prayers, a divine luster sprang from the heart of Lord Shiva and bodies of all gods forming the Adhya Shakti. The gods then gave her ornaments, and a lion as a vehicle. She was supposed to fight Mahishasur, the demon. For nine continuous days and nights, Goddess Adhya Shakti-Durga fought the demon-Mahishasur, and finally emerged victorious at the end.

Saturday, October 16, 2010

Gold Rush

Gold has suddenly become a hot investment option. I have always felt one must have exposure to Gold in our portfolio and here are some of the reasons why I feel so.

http://investmentsfordummieslikeme.blogspot.com/2010/10/go-for-gold-guest-post.html

Saturday, October 9, 2010

Financial Goals and Asset Allocation

This week, lets step aside and take a look at the purpose of investments and financial planning. I always like to say we work for our money but does the money work for us?
People get up every morning, go to work and come back in the evening. Now, what is the purpose of doing this day in and day out? It could be job satisfaction, work as a hobby but the primary purpose of going to work is to earn money.
The idea of setting financial goals is like setting milestones to take us through the journey called life. People work so that they can have a comfortable retirement. ow, what is the definition of a comfortable retirement? It means doing what we want without having to think about where the money will come from.
The only way of doing this is by starting to save from day 1 when you start working and letting the magic of compounding to do its bit. For example Rs 1 lakh saved after 30 years at a rate of 8 pc becomes about 10 lakhs. Now, for 5 lakhs to become 10 lakhs at the same rate of interest of 8 pc would take 10 years. Starting to save early, is just the first part of journey towards financial independence.
Next is to set goals. Goals as in by the age of x I would like to have saved y amount of money. Only, when we have goals i front of us can we save money towards. Now, buying a car, going on a vacation are not financial goals. These goals are minor goals which we need to have to live life towards the fullest but not the primary goals.
Once we have decided how much amount we want to have saved by x age is to go about achieving it. This could be achieved through a mix of real estate, gold, equity and debt instruments. The thumb rule for this is 100 - your age = investments in risky asset classes like equity. For example, a person who is 35 years old can have up to 65 pc of his investments in equity.
A safe mix is usually having Debt instruments of about 50 pc ad rest in equity, gold and real estate asset classes.
Now, a person has started investing early, has his goals in place, the next step is to keep monitoring them. This could be at pre-defined intervals of say 3 months and bring in course corrections as and when required.
Next time, we could look at proper asset allocation. The pros and cons of each asset in asset allocation.
To sum up,
1. Start investing early and let compounding do its tricks
2. Set goals in life, by which age you want to save up how much
3. Do proper asset allocation
4. Keep monitoring regularly.

By following this simple 4 point program, you are on your way towards financial independence.

Sunday, October 3, 2010

Why FIIs invest in India

Here I am taking an illustration given by my friend Aarti. The FIIs stand to gain much more than us Indians. Here is why?
The rupee rate is 48 rupees to 1 USD. Assume, we buy Nifty BEES (Benchmark ETF) at 480. This means Nifty is at 4800. We get to buy 100 units of Nifty ETF with 1000 dollars.
ow a couple of months have passed by and Nifty reached 5350. Our ETF rate has gone to 530. The Indians earn 10.41 pc rate of return. Now our friend Mr Bernanke continues with his low interest rate regime, interest rate of almost 0 pc, he prints some more dollars, gold rallies and USD weakens. Now 1 USD gives us 44 rupees. We decide to encash our Nifty BEEs 100 units. We get back Rs 53000 = 53500/44 = 1215 dollars. A return of almost 21.5 % and the game goes on.
If the rupee strengthens to 42, we make even more returns. Now, FIIs are always leveraged that is they for every 100 dollars they invest, they can buy up to 300 dollars worth of stocks. They can make triple the profit. At the opportune time, they sneak away and the game begins in some other emerging market.
This is the secret of the so called FII flows.Of course, one can go with the trend and aim to move away before the music stops playing.

IDFC Infrastructure Bond Issue

Every week, we look at equity related offerings. This week, lets step aside and look at some debt offering. IDFC is coming with an Infrastructure Bond issue which closes on October 18th 2010.
The government has issued a notification that an additional amount of Rs 20000 can be invested in, other than your limit of 1 lakh rupees under section 80. This means this Rs 20000 will be exempt from your taxable income this year. Depending on which tax slab you fall under, 10 %, 20% or 30 %, you will save additional income tax of Rs 2000, Rs 4000 or Rs 6000 respectively. (I am not computing the surcharge amount- the real rate of taxation can be 10.3%, 20.6% or 30.9%)
In addition to this, you get 4 different options of investment as below. The bonds have a lock-in period of 5 years and have a maturity period of 10 years. 2 options are cumulative ones and 2 are annual interest options. For the bods yielding 7.5%, after 5 years the company will give a buyback option and for those yielding 8 pc no buyback option.

I would invest in the 8 pc option bonds as even if there is no buyback option, the bonds are listed on the NSE and can be traded after the lock-in of 5 years.
IDFC is a triple A rated paper, interest rate of 8 pc, along with the tax benefit makes these bonds one of the best investment options going around.
Please note the interest is taxable and will attract the normal rate of taxation. With the tax break the real return actually works out to as high as 12-14 pc pre-tax.
Also, even though the benefit of tax breaks is only 20000 rupees, one can invest higher amounts. The 10 year bond yield is around 8 pc.
At current market valuations, debt is another option one must look at as interest rates may peak after maybe another 100 basis points hike. Bond yields and bond prices are inversely proportional. When rate cuts come in, bond prices rise and the returns in those years can be as high as 20 pc.
L&T NCDs are listed on the NSE and those are another good option for those looking at good quality paper, liquidity and decent returns.
Our asset allocation should not only be equities, but also gold, debt and other asset classes. I am not a big fan of real estate investment other than place where I live simply for the myriad red tapism, difficulty in disposing and the procedural hassles. I prefer assets where I can liquidate and get cash in max 3 days.

Sunday, September 26, 2010

Deviations from the Moving Averages

Markets tend to go through phases when they keep on going higher at a sustained rate or lower at a steady phase. They tend to deviate from their average prices of various periods like 20, 50, 100 and 200. Eventually they always come back to the average prices.
The genesis of this study came from SS who writes a very informative blog at http://timamo.blogspot.com/ which I love for its out of the box thinking. I have taken his study of 50 periods further and applied to 20, 50, 100 and 200 days moving averages.

1. 20 day average (5709)


The deviation is testing a resistance from where it has reversed many times. If it breaks this, we can look at 6850-7000 levels.

2. 50 day average (5549)


Much like the 20 MA deviation, here also we are at a critical resistance if we break this off we go to at least 6660-6700 levels.

3. 100 day average (5355)


Here too, if we break out of current trend line off we goto test 6600-6900 levels.

4. 200 day average (5236)

Here a small breakout is already visible giving us a target of 6800.

Bottom line to conclude is we have to follow the trend. If we break 6075-6100, all the previous resistances of deviation lines would be gone which could mean we march on to stratospheric levels. Levels of 6800 etc would put the P/E in bubble zone of 2000 and 2008 leading to very sharp cut. The averages themselves will provide supports on the downside.
Alternatively, we could reverse from here, give or take 100 points on the upside.

Sunday, September 19, 2010

Put Call Ratio and the Nifty


The definition of Put-Call Ratio (PCR) is as follows:
The ratio of the volume of put options traded to the volume of call options traded, which is used as an indicator of investor sentiment (bullish or bearish).
1 school of thought says that a high PCR means more number of Puts have been written and markets should go ahead. Another school of thought says the converse.
Lets go by the data in hand for past 1 year.The market has bottomed when PCR was around 0.8-0.9 and topped when it was 1.2 or above.
I have marked in black the instances where the PCR was above 1.2. At this point of time, the market remains flat for a day or 2 by which time the PCR comes down to lower level or the market tanks.
This last leg of rally, the PCR was low (below 1.2), thus allowing the markets to go higher. On Friday, it crossed the Danger mark of 1.2, thus indicating caution.
Going by that logic next week should be flat or down. Let us see what comes true.

Tuesday, September 14, 2010

Hotel Leela

I had written a write-up on Hotel Leela for Subhankar's blog.
In this month’s guest post, Nishit speculates that following the stake purchase in East India Hotels by Reliance, a possible consolidation in the hotels sector may follow with Hotel Leela as the likely target. Leave a comment to let us know if you have a different view.
Continue Reading at:
http://investmentsfordummieslikeme.blogspot.com/2010/09/hotel-leela-next-takeover-target-guest.html

Friday, September 10, 2010

India VIX and Market Tops


I decided to study the India VIX and its behaviour when the markets hits a top. Thanks to Natasha for pointing me to this study. First of all what is the India VIX?

Volatility Index is a measure of market’s expectation of volatility over the near term. Volatility is often described as the “rate and magnitude of changes in prices” and in finance often referred to as risk. Volatility Index is a measure, of the amount by which an underlying Index is expected to fluctuate, in the near term, (calculated as annualized volatility, denoted in percentage e.g. 20%) based on the order book of the underlying index options.

India VIX is a volatility index based on the NIFTY Index Option prices. From the best bid-ask prices of NIFTY Options contracts, a volatility figure (%) is calculated which indicates the expected market volatility over the next 30 calendar days. India VIX uses the computation methodology of CBOE, with suitable amendments to adapt to the NIFTY options order book using cubic splines, etc.

This is as per NSE India site. For more information on VIX, refer this link:

http://en.wikipedia.org/wiki/VIX

1. Looking at the last 4 rallies, the VIX when the market has hit the top has progressively decreased.


2. High VIX readings mean investors see significant risk that the market will move sharply, whether downward or upward. The highest VIX readings occur when investors anticipate that huge moves in either direction are likely. Only when investors perceive neither significant downside risk nor significant upside potential will the VIX be low.

3. Each of the subsequent VIX reading at the top has been in the range of 82-85% of previous VIX reading at the top. Right now we are at the very low end of the all-time range of VIX. This might also mean that the short term top is close by.


All these studies can prove to be academic exercises also. Markets have a mind of their own.

Sunday, September 5, 2010

Black September: Or is it?


Most of us would have heard of Black September. No I am not talking about the infamous Munich massacre but the theory that the markets would tank in September. I did some number crunching from the years 2001-2009 to check out the facts and fiction.

1. In all the years from 2001 onwards, the low of September has been at least 0.5 % less than August close. This is irrespective of it being a bull or bear run. August close for this year is 5402. So, going by history we should see at least 5370 once this September.

2. The highs hit in September vary from 0.5% in a bear market to 10-12 % in roaring bull runs. This year the high recorded is already 2 pc higher than August Close. Since we are in somewhat neutral zone, neither roaring Bull run nor Bear run, if we take the Mean we get a rise of around 4-5 %. This would take the Nifty to 5600-5650 range as the high point.

3. The September Closing value gives us an average of 2 pc rise and extremities at -12 pc and higher end 9 pc. The low point was recorded in a year of Black Swan event, the 9/11 crash. The high point was in year of the bull runs of 2005 and 2009. If we take the average, it comes to about 2 pc which is around 5500.

The conclusions we can draw from the above data is expect a minimum low of 5370, high of 5600-5650 and a close of 5500. This will stand invalidated if there is another Black Swan event like terrorist attack, bank shutting down, European crisis etc.

Overlaying this analysis with where critical support and resistance levels are, at around 5370 trim down your shorts if you have any and wait for convincing breach of 5350.
Above 5550, go long with a stop loss of 5510. The month is ahead of us, lets see how it plays out.
Black September group was responsible for the Munich Games massacre of Israeli athletes in 1972. More details from wiki at below link:
http://en.wikipedia.org/wiki/Munich_massacre

Tuesday, August 31, 2010

Importance of 5349

1. This is the for the past 8 weeks. A break of this take us to 5225, the previous low.
2. Monthly pivot at 5357 and weekly support at 5357 are key levels.
3. Next support at around 5300.
4. 50 ema at 5387, we can have a bounce uptil this point.

Strategy: Book part shorts and watch a clean break of 5349. resistances at 5387, 5451. Go long only above 5400 if you are aggressive.

Sunday, August 29, 2010

Nifty Tops and Difference from the Moving Averages

Lets see the last few times when the nifty hit major tops and its behavior after that. Thanks to Natasha for suggesting this line of analysis.

1. Lets take the 20, 50, 100 and 200 MA and the distances by which they were above the Nifty in percentage terms when the markets hit the Tops. As each next top is hit, the out performance is steadily coming down. This implies that the rises are getting slower.


2. Next I took the falls after each rise. They have more or less have been same, slightly decreasing. Assuming that 5550 was a top, average of last 3 falls gives us a target of 4920. I would put a target in the range of 4920-4950.


3. Lets look at the channel we have been moving in for almost past 1 year. Logically, now that it has touched the upper end, the immediate target should be 4950-4980 in the next 5-6 weeks.

4. The interesting part comes after we come to the lower end of the channel at about 4950. The channel width is 600 points. If the bull run continues, the rise should continue. If the channel breaks, the next target comes at around 4350 this is also the bottom made in last August.

5. The FIIs have sold for last 3 days albeit small amounts. This is the first warning sign. Also, the A/D line has been going down. Very few stocks have been advancing to declining. Thanks to Lakshmi Ramchandran for the graph.


6. The condition for break of 20 EMA has been fulfilled as in the graph attached. Now, it should move up to the 20 EMA or slightly above and then fall. This should take us to 5460-5480 in the early part of the week before falling again.


To sum up, the Dow has just fallen away with no bounces. A sell-off in 9 out of last 12 sessions for no apparent reason. Its not as if any Bank has shut down, or European crisis. Gold has risen to almost all time highs (just about 20 dollars from its previous all-time highs). RIL has hit 950 a 52 week low when the Nifty is near its 52 week high.

All the above factors seem to make me just a wee bit uncomfortable.

Editor's Note: The above assumptions are invalidated if the channel broken upwards above 5550.

Sunday, August 22, 2010

FII Flows: How dependent are we on them?


I did a study yesterday on the 4 market rallies since July'09. I came to some startling conclusions. They do not paint a very happy picture. Our markets are getting shallower even if all the drumbeats say new all time highs.

Have a look at the images.

1. The rallies are getting slower. The first 3 rallies had about 18 points per day gain on an average. Last rally has barely sputtered to 11 points a day.The rise has been very slow in the last rally. This means Option Sellers make huge money. If you buy Calls, the time decay eats away the profits. If you write puts you carry a big risk of a market crash.


2. The FII have had to pump in more cash to move the markets. For the first 2 rallies, it was just 10-12 crores per point. This went up to 23 crores per point for the third and now 28 crores per point.

3. The DIIs have in fact been sellers in 3rd and 4th rallies. LIC seems to be following buy low sell high principle perfectly.


4. Most surprisingly, the crores in terms of FII+DII to move 1 point of Nifty has reduced to 11 from about 17. Now here is the catch. What does this mean?
a. Less amount of institution money is required to move the Nifty up by 1 point, but more amount of FII money is needed.
b. This means there is a third invisible player in the market (The Retail is out) or the volumes have gone down drastically.

Since I do not believe in re-inventing the wheel, here is Lakshmi Ramchandran's analysis on volumes:
http://vipreetinvestments.blogspot.com/2010/08/reigning-nifty-23rd-august-2010.html

Now, what do we conclude from all this?

a. We are more dependent on FII flows for markets to rise.

b. If for any reason, they turn net sellers, there would be sharp fall in a shorter time, even maybe a downward circuit since there is no safety net.

Best course is to watch FII fund flow everyday on NSE site. If they are net sellers for 3 days in a row or sold 1 billion dollar worth in 5 trading sessions then get out of the markets.

Tuesday, August 17, 2010

Cairn India

I had written a guest post for Subhankar's blog today.
Oil is also known as Black Gold. The lust for oil has led to many wars. Empires have been built on oil and lost due to oil. Oil prices in the next decade may very easily rule above 100 dollars a barrel. Do not believe it?
Continue Reading at:
http://investmentsfordummieslikeme.blogspot.com/2010/08/cairn-india-oil-story-worth-betting-on.html

Sunday, August 15, 2010

Diwali Picks Performance

Last Diwali, Lakshmi and I had prepared a Diwali Picks presentation. The below chart gives the performance.

http://money-manthan.blogspot.com/2009/10/diwali-picks.html

The peak performance was 26 pc and average was 20 pc as compared to 6 and 6.8 pc of the Nifty.
I would recommend booking 50% of the portfolio and remaining in cash. Some of the things we noticed:
1. Maruti Sales have recorded all time highs since Diwali, but share prices have gone no where.
2. Titan is a mid-cap which has doubled i value. Each portfolio needs to have certain mid caps.
3. Nifty has gone nowhere but individual stocks have given returns.

Saturday, August 14, 2010

The Deadlock Continues

The Market continues to test everyone's patience. The Dow was down almost 3.5 % during the week. Our markets gained only 0.2 pc or 13 points on the Nifty. The Sensex rose by 24 points but 84 points were contributed by SBI.

1. FIIs have pumped in over 4000 crores in August and 16000 crores this year.The nifty has rallied only 2 pc in spite of almost a billion dollars being pumped.


2. The Gann fans show that the critical resistances around 5500 have still not been cleared.


3. The only guys making money are the Option Writers. The Indian VIX has collapsed to all time lows which also indicate the possibility of the market correcting.

4. The domestic triggers are exhausted and there is absolutely no life in the markets. The best option is to sit back and enjoy the Independence Day weekend.

My guest post would be posted on Subhankar's blog in the next 2-3 days, catch that.

Wednesday, August 11, 2010

Watch for Decisive Break of 20 ema


A quick mid week update. Just have a look at attached chart. Whenever 20 ems is broken cleanly we have a big correction of additional 400-500 points. 20 ema is at around 5415. If gap down tomorrow chances are 4900-5000 is immediate target in next 4-6 weeks.

Sunday, August 8, 2010

Big Move coming up

The past few weeks has seen a range-bound action. The Market has been unable to break out or break down. Such Ranged moves occur typically before a huge breakout or a breakdown. Lets look at a few technical and fundamental factors.

1. The Bollinger Bands have contracted and the range is 5360-5478. Breach of either these 2 levels will lead to a big move either ways.


2. There is huge Open Interest at Puts of Strike prices 5400 and below. In the past few months this has meant that these strike prices have served as floor to the market. Conversely, if there is a fall, the this heavy OI would serve as a trigger for a bigger slide. All this suggests that August is a make or break month. If we move up from here, new all time highs, else a substantial correction.


3. The Average True Range (ATR) has contracted to about 59 for a period of 20 days. This further signifies a big move. Last time in 2007, it triggered a massive rally.

4. The 50 ema at 5320 and 20 ema at 5400 are key levels to watch out for. In addition 5350 is a key level, since it has served as a low for past 4 weeks.


5. The Gann chart shows we are at a long term resistance at 5460. Breach of this convincingly and off we go to new highs.


6. Fundamentally, the results are in, the monsoon is on track. There are no fresh upward triggers left. Downward too, it will take some big global event rather than domestic event to trigger a slide. By big global event, I mean a war, a big corporation going bankrupt, something huge. There seem to be no clouds on the horizon, but it may well be the lull before the storm.

Strategy would be to wait and watch. Watch 5500 or 5350 to break. To be cautious 5400 put at 60 or 5300 put at 33 may not be a bad hedge for the portfolio. Treat it as insurance amount.

Saturday, August 7, 2010

Ayn Rand on Gold

I was reading the The Atlas Shrugged by Ayn Rand and came across this piece on Gold which was written by her in 1957.

"Whenever destroyers appear among men, they start by destroying money, for money is man's protection and the base of a moral existence. Destroyers seize gold and leave to its owners a counterfeit pile of paper. This kills all objective standards and delivers men into the arbitrary power of a arbitrary settler of values. Gold was an objective value, an equivalent of wealth produced. Paper is a mortgage on wealth that does not exists, backed by a gun aimed at those are expected to produce it. Paper is a check drawn by legal looters upon an account which is not theirs; it is upon the virtue of the victims. Watch for the day when it bounces, marked "Account overdrawn"

This was written almost 53 years ago. An idea whose time has come?

I would strongly recommend Atlas Shrugged and Fountainhead by Ayn Rand. The above words are the most profound I have come across in a very long time.

Saturday, July 31, 2010

Interest Rate Hikes: More to Follow

It was an Action packed week, with RBI Policy, RIL Results and Options Expiry. The week also offers pointers to the future direction of the markets.

1. RBI hiked Repo Rates by 25 basis points and Reverse Repo by 50 basis points. Repo is the rate at which RBI lends to the banks and Reverse Repo is the rate at which it borrows from the commercial banks. The CRR or the Cash Reserve Ratio was left untouched.
2. The RBI sent out a message that further rate hikes were imminent. What does this all mean? It means for one that you would get more interest for your fixed deposits. Already many banks have started increasing the rate of FDs. The reason for doing this also because the credit growth is much than the deposit growth. There is also too much easy money available for speculative activities.
3. By increasing the rates, it would be more expensive for borrowers to borrow, thus cooling down the economy. The whole balancing act for the RBI is to keep the economy growth while at the same time not allow inflation to spiral out of hand.
4. Home loan and auto loans will rise though not immediately. The very fact that there have been 3-4 hikes this year and interest rates of loans have not gone up shows how much excess cash is there in the system.
5. The RIL results were just about ok. No great surprises. The surprises lie in the future with KG Basin gas, Shale gas, and the broadband activities. The stock reacted negatively to close about Rs 1015. If RIL does not rise, the market is going nowhere.
6. ONGC posted poor results on subsidy outflow. I would avoid this stock and go for Cairns instead which is pure Oil play.
7. The Options Pain came correct and we had this series expiry at about 5408. Remember usually the only guys who make money are the Option Writers.
8. The Result season is out, the monsoons are factored in. There are no triggers to move the market yet. The market will continue in this range for some more time or some negative news globally would bring the markets down.
9. The Bollinger bands have contracted and the width is just 130 points. Last time such a contraction happened the markets tanked. Watch for the breach of 5352 or 5449 to go short or long. 5352 on the Nifty is crucial also because it is the low of past 3 weeks.

Sunday, July 25, 2010

Option Pain

This is Option Expiry Week and lets look at what Options Expiry is all about?

The definition for Option Pain taken from Optionpain.com is:

"In the option market, wealth transfer between option buyers and sellers is a zero-sum game. On option expiration days, the underlying stock price often moves toward a point that brings maximum loss to option buyers. This specific price, calculated based on all outstanding options in the market, is called Option Pain. Option Pain is a proxy for the stock price manipulation target by the option selling group."

In this definition, we can extract the following assumptions:

1. The Options Game is a Zero-Sum Game in which 1 party loses and the other party wins.
2. The Option Writers are usually big institutions with enough Capital to move the Market towards the strike price where maximum Option Buyers will get nothing.
3. This is precisely the reason we find that during many expiration, Markets are held up till Expiry day and once Expiry is through the markets stop rising or vice-versa.

Below is the snapshot from Options Oracle Tool for this expiry. The Max Pain is at 5450. This suggests an expiry between 5400 and 5500. Lets see if it comes true.

Markets Next Week

The markets have certain key events lined up for this week:

1.The RBI Credit Policy on Tuesday 27th July. A Repo and Reverse Repo hike of 25 basis point is already factored. If there is no CRR Hike and no 50 basis points hike in Repo and Reverse Repo then expect a relief rally

2. The Stress Tests are done with. 7 out of 91 Banks failed. The jury is still out on whether the tests were rigorous enough. Expect the party to continue for a few days more.

3. This rally is 8 weeks old and achieves times equality with previous rally. I expect that this week may end on a negative note week-on-week. If not, then we are onto something very bullish. All Rallies since March 09 have been diminishing time – wise.

4. The Monsoons are no more a worry and the results have been overall good. The only way a downward trigger is from global factors.

5. It will now take a Black Swan event to cause the markets to crash now. Check out what Black Swan means on google.

6. The Breadth is poor and number of stocks making new highs is very less. Classic Distribution? Time will tell. Reliance is stuck at 1060 and for the Markets to comprehensively move up Reliance has to go above Rs 1100.