The rally continues. Resistances have come and gone and the market is at the doors of the 200 SMA. Is a new bull market born? What does one do in the current scenario?
1. The relentless march has been on the back of FII flows. Dollar is back to 49.50 from 54. In a month's time have the fundamentals changed so much? It is the FII money which is pumping the markets up on steroids.
2. This also means that either the fall from Nov 2010 is over or it can be broken into A - B- C legs. A was 1807 points. B leg can have targets of 5432 and 5648 followed by a C leg which can terminate around 3800.In this case, B leg can continue for 5-6 months till the month of May 2012.
3. This could also just be C-2 which is exceptionally powerful and terminate around 5250-5300 to commence the fall.
4. Till the FIIs keep pumping in the money there is no way the markets will fall.
The market is at a tricky juncture with no clear answers. The best is to wait out for clarity to emerge. First signs of a correction to this up move comes below 5123.
For those interested in mid caps and large cap picks, we have Lakshmi's Cherry Picks and Mid cap ideas.
Saturday, January 28, 2012
Thursday, January 26, 2012
Heading into last cluster of resistances
The trend line joining all the tops from 6339 comes at around 5200. The 200 DMA which is the dividing line between a bear and bull market also comes at 5208.
The 80 pc retracement of 5400 - 4532 comes at 5226.
Above 5230, we have entered a fresh bull market.
The 80 pc retracement of 5400 - 4532 comes at 5226.
Above 5230, we have entered a fresh bull market.
Sunday, January 22, 2012
Markets at the Top or at the begining of a new Bull Run
The markets have run up and we has the best January in many years to log in a monthly gain of 9.2%. Does this mean the entire bear market is over or where do we stand? Lets try and explore.

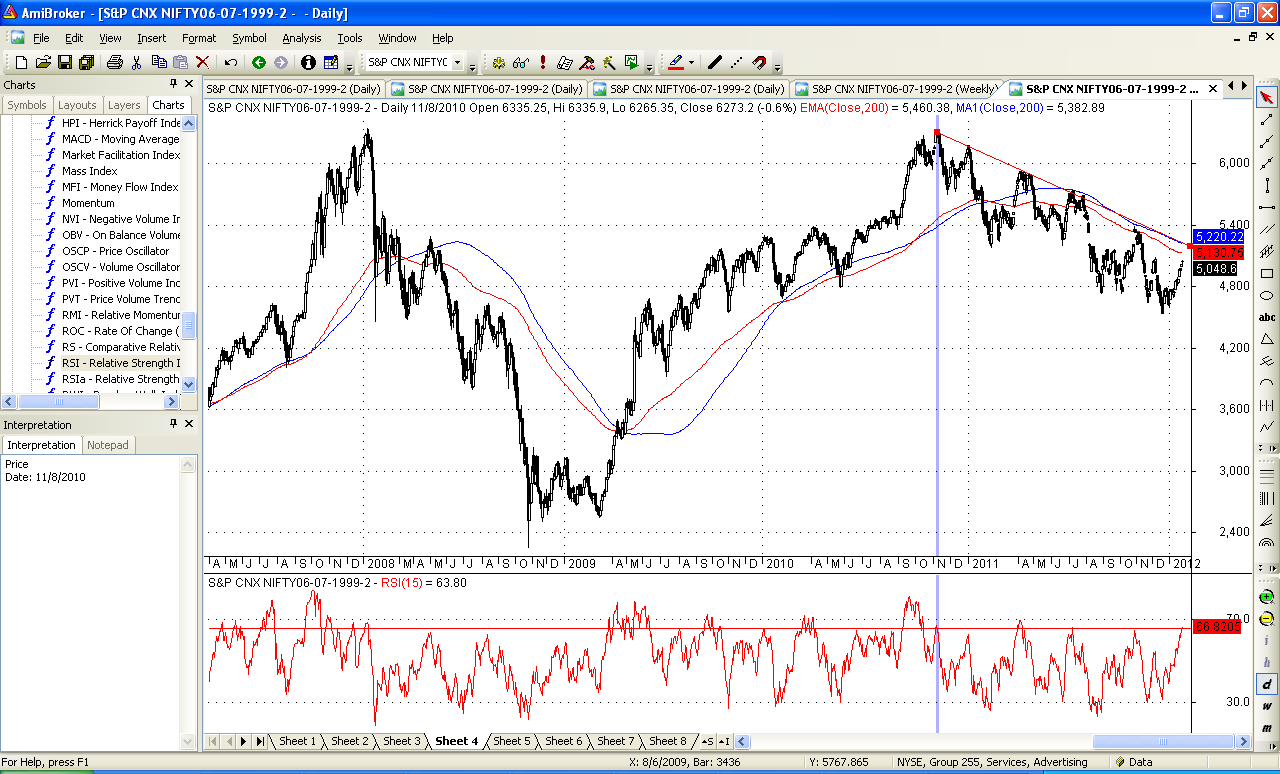
1. We had assumed the current up move was counter to the fall from 5400 to 4532. The Fibo retracements came to 4863, 4966 and 5068. We can say this is a fresh up move only above 5226 which is also 200 DMA.
2.The falling trend line from 6339 joining all the tops also comes at around 5150-5200 and the 200 EMA at 5130. If we are able to surpass all these we can say a fresh bull market is upon us.
3. The markets in many of the bear markets come and test the 200 EMA and DMA. The attached image gives us a good idea of it. Sustaining above the 200 averages is a good sign to go long.
4. Many of the indicators are overbought and at least a retracement of the up move is possible. Supports come in at 4860, 4798 and 4735. We are back into positional shorts only below 4638 and positional longs above 5226.
5. Looking at the RSI indicator, this is the top of the indicator range if its a bear market rally. Above this we go into newer territory.
6. The RIL results came and disappointed and I would not read too much into the buy back. The last buy back about 7 years ago led to very little stock being bought from the open market.
7. RBI credit policy is on Tuesday and no CRR cut will lead to a fall as a CRR cut has been priced into the current prices.
8. The FIIs have been relentlessly buying in the month of Jan. They have bought close to 1 billion USD. Only a reversal of these inflows can lead to markets turning down.
Since we are closer to the top end of the range, prudence would be to stay out of the markets as a short term correction will be healthy.One can always re-enter above 5226.
Those interested in mid caps and large cap ideas, there is always Lakshmi's mid cap ideas and Cherry Picks.
Tuesday, January 17, 2012
Analysing the time duration and magnitude of rallies
I took a look at the last few rallies and for the number of sessions they ralied along with the magnitude over the last year.
1. 4639 - 5099 = 460 points and 8 sessions
2. 4732 - 5400 = 668 points and 16 sessions
3. 5178 - 5944 = 766 points and 38 sessions
4. 5196 - 5744 = 548 points and 14 sessions
Current rally is 4532 - 4935 = 403 points and 21 sessions, the slowest so far.
Conclusion: This is retreacemnt pull back rally. Beyond 4992, it would mean this is a larger rally, till then it remains just a normal pullback rally.
Sunday, January 15, 2012
Markets: Expect Resistance Ahead
The markets had another positive week gaining another 2.5 % to end at 4866. Let us try and see the factors which would drive the markets in the week ahead. There is a slew of corporate earnings ahead.
1. The early results have been lackluster. Infosys disappointed with its guidance and HDFC results also were nothing to write home about. The early results usually set the tone for the results ahead. If good results do not come in this week, then expect poor results over all. The companies declaring outstanding numbers usually declare their results early.
2. This has been one of the slowest pullback rallies. The markets tanked from 5099 to 4532 in 9 trading sessions. In 19 sessions after that we have pulled back about 63 pc. We have taken about twice the sessions to pullback only 2/3rds of the fall.
3. If this is wave 2 of C5 then targets were 4863, 4966 and 5066. In any case, 5100 is the top for the markets.Beyond that we can see the contours of a new bull run.
4. In the immediate term, both the Bollinger Band and the other indicators are overbought and I expect a correction in the first half of the week at least. Supports on the downside are the trend line support at 4765 and 4790 - 4800 band. Below 4672, one can say that the trend has turned down.


5. The Euro downgrades will ensure that the week will begin on a soft note.
Strategy: 4671 on the downside is a shorting point for the positional trader. For going long, wait till 4900 is taken out along. In between, sell on rises and buy on dips. The only gainers in this series seem to be option writers. We have a curtailed expiry one day earlier on 25th Jan due to Republic Day on 26th. The decay in Options will be faster for this series.
Point to note: We never has 2 consecutive positive monthly closes since this bear market started in November 2010. If January is positive then February should be negative.
For those interested in individual stock picks, we have Lakshmi's Cherry Picks and Mid Cap Ideas
Saturday, January 7, 2012
The Importance of 4825 and Trend lines

The market closed up about 2.7 pc for the week. The Interesting part was the number of times it was resisted at 4780-4800 in this week. The coming week will be decisive for the markets.
1. The markets got resisted at the 4780 mark for about 3-4 times this week. This is a worrisome sign for the bulls. If it does not break through in the first 2-3 sessions of the week, expect a sound crack in the markets.
2. The trend line from the move down from 5400 comes at 4825 making it a very crucial resistance. If this gets broken decisively expect the markets to visit the 5150-5200 region.

3. For the medium term 5150-5250 have a cluster of important resistances. The trend line joining all the tops from Nov 2010 top of 6339 comes at about 5200. The 200 EMA comes at 5154 and 200 SMA comes at 5254. This region is what decides if the bear market is over.

4. From the Elliot perspective of the 5 wave decline which began from 6339 this is the wave down. Sub wave 1 of the 5th wave started from 5400 and ended at 4532.A fall of 868 points.
Wave 3 from wherever it starts I expect it to take the market about a 1000 points down.
5. The Gilt funds have been given good returns since November. They are up almost 5 pc. The gilts have moved down from about 9 pc to 8.2 pc. Thus a 0.8 pc decline has given a return of about 5 pc.
6. The gridlock continues on the policy front and one can expect no change there. The budget will be presented around March 15th due to the Assembly elections.
For the Nifty, 4650 and 4825 are 2 breakout points. Trade in the direction of the breakout or breakdown.
Now is the time to accumulate good stocks with low P/Es, sound business fundamentals and high dividend yields. Lakshmi and I have identified some good midcaps along with our Investment Cherry Picks.
Sunday, January 1, 2012
January: What does history tell us about January
Taking into consideration how the market has fared in the last 12 January months, there are certain interesting observations one can come up with.

1. The market has fallen on 7 occasions and risen on 5 occasions.3 out of the 4 occasions were in 2000, 2001 and 2002. In recent years the markets have had a negative January.
2. The markets had given a double digit negative fall in 2008 (16.1%) and and 2011 (10.2%)
3. The rises have been fairly muted while the falls have been quite severe.The max rise has been 8.6% and the max fall has been 16.1%. The average fall has been 6.4 % and the average rise has been 4.64%
4. If we take December closing of 4624, the on closing basis we have a range of 4328 and 4827.
5. If we take the sequence, the market has always followed a Fibonacci sequence before reversing. 3 positive closes, 3 negatives closes, 2 positive closes, last 4 closes have been negative so to complete the Fibonacci sequence this Jan should also be negative.
6. If January closes again on a negative note, then February will be positive.Never have markets given more than 3 negative closes in a row.
Markets update:
The markets are stuck in a range. Short below 4585 and go long above 4732. Till then it is stuck in a range.
The NHAI bond issue is very attractive considering that the interest is tax free. For those interested in equity picks, there is Lakshmi's Cherry Picks available.
Subscribe to:
Posts (Atom)