1. This is the for the past 8 weeks. A break of this take us to 5225, the previous low.
2. Monthly pivot at 5357 and weekly support at 5357 are key levels.
3. Next support at around 5300.
4. 50 ema at 5387, we can have a bounce uptil this point.
Strategy: Book part shorts and watch a clean break of 5349. resistances at 5387, 5451. Go long only above 5400 if you are aggressive.
Tuesday, August 31, 2010
Sunday, August 29, 2010
Nifty Tops and Difference from the Moving Averages
Lets see the last few times when the nifty hit major tops and its behavior after that. Thanks to Natasha for suggesting this line of analysis.
1. Lets take the 20, 50, 100 and 200 MA and the distances by which they were above the Nifty in percentage terms when the markets hit the Tops. As each next top is hit, the out performance is steadily coming down. This implies that the rises are getting slower.


2. Next I took the falls after each rise. They have more or less have been same, slightly decreasing. Assuming that 5550 was a top, average of last 3 falls gives us a target of 4920. I would put a target in the range of 4920-4950.

3. Lets look at the channel we have been moving in for almost past 1 year. Logically, now that it has touched the upper end, the immediate target should be 4950-4980 in the next 5-6 weeks.
4. The interesting part comes after we come to the lower end of the channel at about 4950. The channel width is 600 points. If the bull run continues, the rise should continue. If the channel breaks, the next target comes at around 4350 this is also the bottom made in last August.
5. The FIIs have sold for last 3 days albeit small amounts. This is the first warning sign. Also, the A/D line has been going down. Very few stocks have been advancing to declining. Thanks to Lakshmi Ramchandran for the graph.

6. The condition for break of 20 EMA has been fulfilled as in the graph attached. Now, it should move up to the 20 EMA or slightly above and then fall. This should take us to 5460-5480 in the early part of the week before falling again.

To sum up, the Dow has just fallen away with no bounces. A sell-off in 9 out of last 12 sessions for no apparent reason. Its not as if any Bank has shut down, or European crisis. Gold has risen to almost all time highs (just about 20 dollars from its previous all-time highs). RIL has hit 950 a 52 week low when the Nifty is near its 52 week high.
All the above factors seem to make me just a wee bit uncomfortable.
Editor's Note: The above assumptions are invalidated if the channel broken upwards above 5550.
Sunday, August 22, 2010
FII Flows: How dependent are we on them?
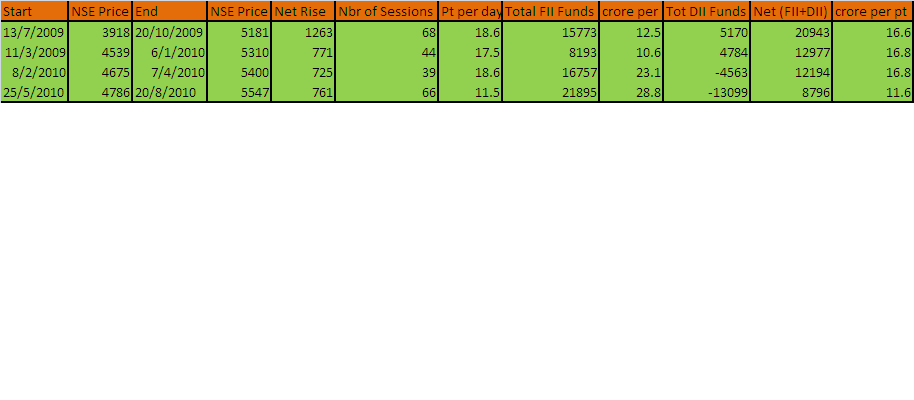
I did a study yesterday on the 4 market rallies since July'09. I came to some startling conclusions. They do not paint a very happy picture. Our markets are getting shallower even if all the drumbeats say new all time highs.
Have a look at the images.
1. The rallies are getting slower. The first 3 rallies had about 18 points per day gain on an average. Last rally has barely sputtered to 11 points a day.The rise has been very slow in the last rally. This means Option Sellers make huge money. If you buy Calls, the time decay eats away the profits. If you write puts you carry a big risk of a market crash.

2. The FII have had to pump in more cash to move the markets. For the first 2 rallies, it was just 10-12 crores per point. This went up to 23 crores per point for the third and now 28 crores per point.
3. The DIIs have in fact been sellers in 3rd and 4th rallies. LIC seems to be following buy low sell high principle perfectly.

4. Most surprisingly, the crores in terms of FII+DII to move 1 point of Nifty has reduced to 11 from about 17. Now here is the catch. What does this mean?
a. Less amount of institution money is required to move the Nifty up by 1 point, but more amount of FII money is needed.
b. This means there is a third invisible player in the market (The Retail is out) or the volumes have gone down drastically.
Since I do not believe in re-inventing the wheel, here is Lakshmi Ramchandran's analysis on volumes:
http://vipreetinvestments.blogspot.com/2010/08/reigning-nifty-23rd-august-2010.html
Now, what do we conclude from all this?
a. We are more dependent on FII flows for markets to rise.
b. If for any reason, they turn net sellers, there would be sharp fall in a shorter time, even maybe a downward circuit since there is no safety net.
Best course is to watch FII fund flow everyday on NSE site. If they are net sellers for 3 days in a row or sold 1 billion dollar worth in 5 trading sessions then get out of the markets.
Tuesday, August 17, 2010
Cairn India
I had written a guest post for Subhankar's blog today.
Oil is also known as Black Gold. The lust for oil has led to many wars. Empires have been built on oil and lost due to oil. Oil prices in the next decade may very easily rule above 100 dollars a barrel. Do not believe it?
Continue Reading at:
http://investmentsfordummieslikeme.blogspot.com/2010/08/cairn-india-oil-story-worth-betting-on.html
Sunday, August 15, 2010
Diwali Picks Performance
Last Diwali, Lakshmi and I had prepared a Diwali Picks presentation. The below chart gives the performance.
http://money-manthan.blogspot.com/2009/10/diwali-picks.html
The peak performance was 26 pc and average was 20 pc as compared to 6 and 6.8 pc of the Nifty.
I would recommend booking 50% of the portfolio and remaining in cash. Some of the things we noticed:
1. Maruti Sales have recorded all time highs since Diwali, but share prices have gone no where.
2. Titan is a mid-cap which has doubled i value. Each portfolio needs to have certain mid caps.
3. Nifty has gone nowhere but individual stocks have given returns.

Saturday, August 14, 2010
The Deadlock Continues
The Market continues to test everyone's patience. The Dow was down almost 3.5 % during the week. Our markets gained only 0.2 pc or 13 points on the Nifty. The Sensex rose by 24 points but 84 points were contributed by SBI.
1. FIIs have pumped in over 4000 crores in August and 16000 crores this year.The nifty has rallied only 2 pc in spite of almost a billion dollars being pumped.

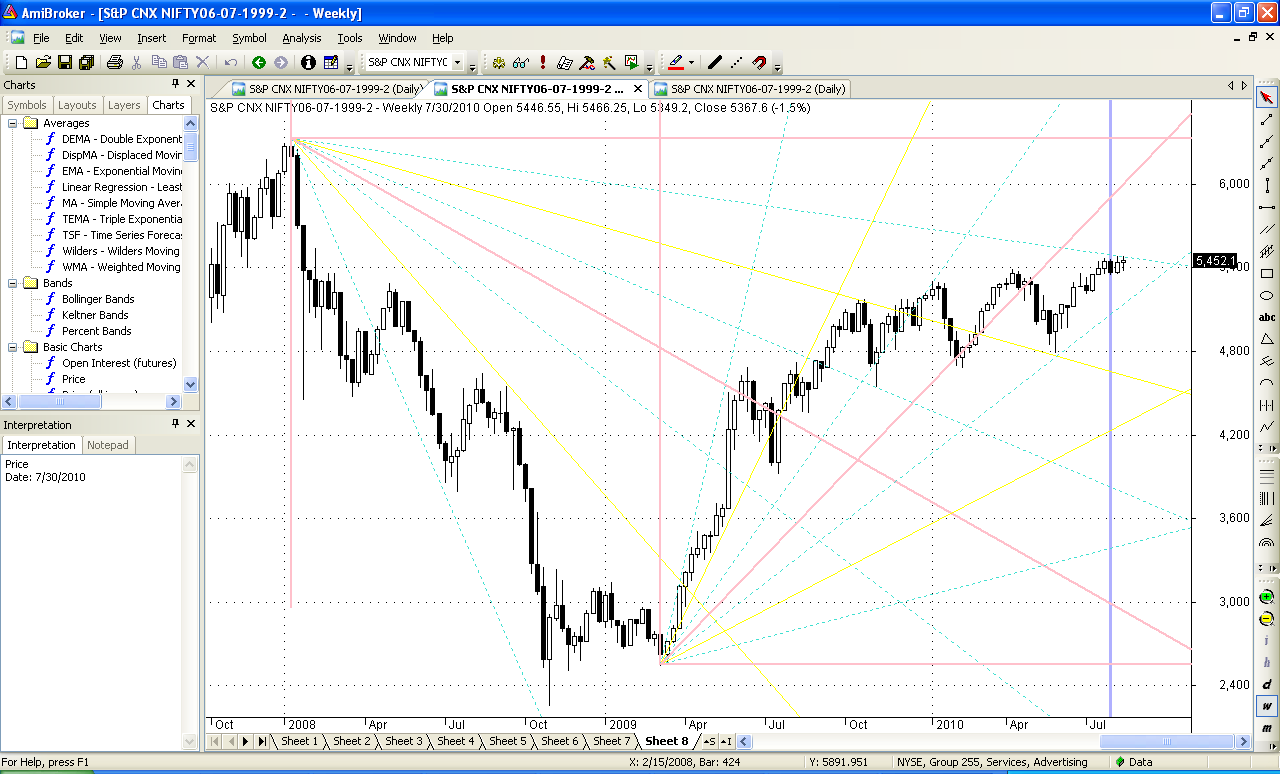
2. The Gann fans show that the critical resistances around 5500 have still not been cleared.

3. The only guys making money are the Option Writers. The Indian VIX has collapsed to all time lows which also indicate the possibility of the market correcting.
4. The domestic triggers are exhausted and there is absolutely no life in the markets. The best option is to sit back and enjoy the Independence Day weekend.
My guest post would be posted on Subhankar's blog in the next 2-3 days, catch that.
1. FIIs have pumped in over 4000 crores in August and 16000 crores this year.The nifty has rallied only 2 pc in spite of almost a billion dollars being pumped.

2. The Gann fans show that the critical resistances around 5500 have still not been cleared.
3. The only guys making money are the Option Writers. The Indian VIX has collapsed to all time lows which also indicate the possibility of the market correcting.
4. The domestic triggers are exhausted and there is absolutely no life in the markets. The best option is to sit back and enjoy the Independence Day weekend.
My guest post would be posted on Subhankar's blog in the next 2-3 days, catch that.
Wednesday, August 11, 2010
Watch for Decisive Break of 20 ema
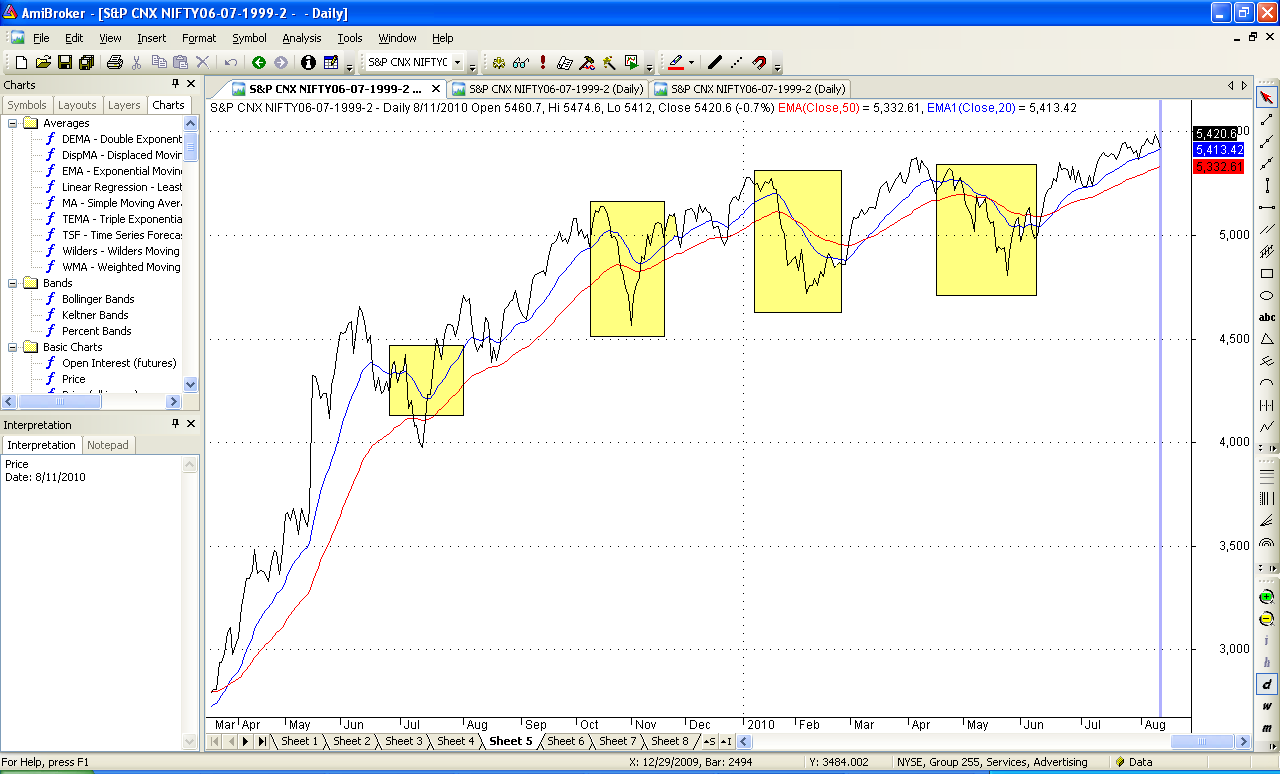
A quick mid week update. Just have a look at attached chart. Whenever 20 ems is broken cleanly we have a big correction of additional 400-500 points. 20 ema is at around 5415. If gap down tomorrow chances are 4900-5000 is immediate target in next 4-6 weeks.
Sunday, August 8, 2010
Big Move coming up
The past few weeks has seen a range-bound action. The Market has been unable to break out or break down. Such Ranged moves occur typically before a huge breakout or a breakdown. Lets look at a few technical and fundamental factors.
1. The Bollinger Bands have contracted and the range is 5360-5478. Breach of either these 2 levels will lead to a big move either ways.

2. There is huge Open Interest at Puts of Strike prices 5400 and below. In the past few months this has meant that these strike prices have served as floor to the market. Conversely, if there is a fall, the this heavy OI would serve as a trigger for a bigger slide. All this suggests that August is a make or break month. If we move up from here, new all time highs, else a substantial correction.

3. The Average True Range (ATR) has contracted to about 59 for a period of 20 days. This further signifies a big move. Last time in 2007, it triggered a massive rally.
4. The 50 ema at 5320 and 20 ema at 5400 are key levels to watch out for. In addition 5350 is a key level, since it has served as a low for past 4 weeks.

5. The Gann chart shows we are at a long term resistance at 5460. Breach of this convincingly and off we go to new highs.

6. Fundamentally, the results are in, the monsoon is on track. There are no fresh upward triggers left. Downward too, it will take some big global event rather than domestic event to trigger a slide. By big global event, I mean a war, a big corporation going bankrupt, something huge. There seem to be no clouds on the horizon, but it may well be the lull before the storm.
Strategy would be to wait and watch. Watch 5500 or 5350 to break. To be cautious 5400 put at 60 or 5300 put at 33 may not be a bad hedge for the portfolio. Treat it as insurance amount.
Saturday, August 7, 2010
Ayn Rand on Gold
I was reading the The Atlas Shrugged by Ayn Rand and came across this piece on Gold which was written by her in 1957.
"Whenever destroyers appear among men, they start by destroying money, for money is man's protection and the base of a moral existence. Destroyers seize gold and leave to its owners a counterfeit pile of paper. This kills all objective standards and delivers men into the arbitrary power of a arbitrary settler of values. Gold was an objective value, an equivalent of wealth produced. Paper is a mortgage on wealth that does not exists, backed by a gun aimed at those are expected to produce it. Paper is a check drawn by legal looters upon an account which is not theirs; it is upon the virtue of the victims. Watch for the day when it bounces, marked "Account overdrawn"
This was written almost 53 years ago. An idea whose time has come?
I would strongly recommend Atlas Shrugged and Fountainhead by Ayn Rand. The above words are the most profound I have come across in a very long time.
Subscribe to:
Posts (Atom)