Sunday, September 26, 2010

Deviations from the Moving Averages

Markets tend to go through phases when they keep on going higher at a sustained rate or lower at a steady phase. They tend to deviate from their average prices of various periods like 20, 50, 100 and 200. Eventually they always come back to the average prices.
The genesis of this study came from SS who writes a very informative blog at http://timamo.blogspot.com/ which I love for its out of the box thinking. I have taken his study of 50 periods further and applied to 20, 50, 100 and 200 days moving averages.

1. 20 day average (5709)


The deviation is testing a resistance from where it has reversed many times. If it breaks this, we can look at 6850-7000 levels.

2. 50 day average (5549)
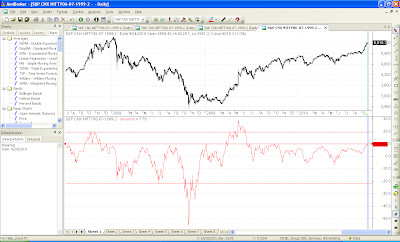

Much like the 20 MA deviation, here also we are at a critical resistance if we break this off we go to at least 6660-6700 levels.

3. 100 day average (5355)


Here too, if we break out of current trend line off we goto test 6600-6900 levels.

4. 200 day average (5236)

Here a small breakout is already visible giving us a target of 6800.

Bottom line to conclude is we have to follow the trend. If we break 6075-6100, all the previous resistances of deviation lines would be gone which could mean we march on to stratospheric levels. Levels of 6800 etc would put the P/E in bubble zone of 2000 and 2008 leading to very sharp cut. The averages themselves will provide supports on the downside.
Alternatively, we could reverse from here, give or take 100 points on the upside.

Sunday, September 19, 2010

Put Call Ratio and the Nifty


The definition of Put-Call Ratio (PCR) is as follows:
The ratio of the volume of put options traded to the volume of call options traded, which is used as an indicator of investor sentiment (bullish or bearish).
1 school of thought says that a high PCR means more number of Puts have been written and markets should go ahead. Another school of thought says the converse.
Lets go by the data in hand for past 1 year.The market has bottomed when PCR was around 0.8-0.9 and topped when it was 1.2 or above.
I have marked in black the instances where the PCR was above 1.2. At this point of time, the market remains flat for a day or 2 by which time the PCR comes down to lower level or the market tanks.
This last leg of rally, the PCR was low (below 1.2), thus allowing the markets to go higher. On Friday, it crossed the Danger mark of 1.2, thus indicating caution.
Going by that logic next week should be flat or down. Let us see what comes true.

Tuesday, September 14, 2010

Hotel Leela

I had written a write-up on Hotel Leela for Subhankar's blog.
In this month’s guest post, Nishit speculates that following the stake purchase in East India Hotels by Reliance, a possible consolidation in the hotels sector may follow with Hotel Leela as the likely target. Leave a comment to let us know if you have a different view.
Continue Reading at:
http://investmentsfordummieslikeme.blogspot.com/2010/09/hotel-leela-next-takeover-target-guest.html

Friday, September 10, 2010

India VIX and Market Tops


I decided to study the India VIX and its behaviour when the markets hits a top. Thanks to Natasha for pointing me to this study. First of all what is the India VIX?

Volatility Index is a measure of market’s expectation of volatility over the near term. Volatility is often described as the “rate and magnitude of changes in prices” and in finance often referred to as risk. Volatility Index is a measure, of the amount by which an underlying Index is expected to fluctuate, in the near term, (calculated as annualized volatility, denoted in percentage e.g. 20%) based on the order book of the underlying index options.

India VIX is a volatility index based on the NIFTY Index Option prices. From the best bid-ask prices of NIFTY Options contracts, a volatility figure (%) is calculated which indicates the expected market volatility over the next 30 calendar days. India VIX uses the computation methodology of CBOE, with suitable amendments to adapt to the NIFTY options order book using cubic splines, etc.

This is as per NSE India site. For more information on VIX, refer this link:

http://en.wikipedia.org/wiki/VIX

1. Looking at the last 4 rallies, the VIX when the market has hit the top has progressively decreased.


2. High VIX readings mean investors see significant risk that the market will move sharply, whether downward or upward. The highest VIX readings occur when investors anticipate that huge moves in either direction are likely. Only when investors perceive neither significant downside risk nor significant upside potential will the VIX be low.

3. Each of the subsequent VIX reading at the top has been in the range of 82-85% of previous VIX reading at the top. Right now we are at the very low end of the all-time range of VIX. This might also mean that the short term top is close by.


All these studies can prove to be academic exercises also. Markets have a mind of their own.

Sunday, September 5, 2010

Black September: Or is it?


Most of us would have heard of Black September. No I am not talking about the infamous Munich massacre but the theory that the markets would tank in September. I did some number crunching from the years 2001-2009 to check out the facts and fiction.

1. In all the years from 2001 onwards, the low of September has been at least 0.5 % less than August close. This is irrespective of it being a bull or bear run. August close for this year is 5402. So, going by history we should see at least 5370 once this September.

2. The highs hit in September vary from 0.5% in a bear market to 10-12 % in roaring bull runs. This year the high recorded is already 2 pc higher than August Close. Since we are in somewhat neutral zone, neither roaring Bull run nor Bear run, if we take the Mean we get a rise of around 4-5 %. This would take the Nifty to 5600-5650 range as the high point.

3. The September Closing value gives us an average of 2 pc rise and extremities at -12 pc and higher end 9 pc. The low point was recorded in a year of Black Swan event, the 9/11 crash. The high point was in year of the bull runs of 2005 and 2009. If we take the average, it comes to about 2 pc which is around 5500.

The conclusions we can draw from the above data is expect a minimum low of 5370, high of 5600-5650 and a close of 5500. This will stand invalidated if there is another Black Swan event like terrorist attack, bank shutting down, European crisis etc.

Overlaying this analysis with where critical support and resistance levels are, at around 5370 trim down your shorts if you have any and wait for convincing breach of 5350.
Above 5550, go long with a stop loss of 5510. The month is ahead of us, lets see how it plays out.
Black September group was responsible for the Munich Games massacre of Israeli athletes in 1972. More details from wiki at below link:
http://en.wikipedia.org/wiki/Munich_massacre