Saturday, May 15, 2010

How the European Woes Affect All of Us


Over the last few weeks, Greece and the so - called PIIGs countries of Europe have been under the spotlight. Let us examine what is the European Union, why the debts of certain member countries are a threat to all and the way going forward.
The roots of the European Union can be traced to the period after the Second World War and the rebuilding of Europe. For those who are interested in reading further, wiki has interesting nuggets:
http://en.wikipedia.org/wiki/European_Union
The EU has a membership of about 27 nations. It is somewhat like Federal Structure of India where weak states are subsidized by the stronger states. This is the reason why in India, the so-called BiMaRu belt ( Bihar, Madhya Pradesh and UP) even if they were not doing well earlier, the other states made up for it.
Now, Greece, Spain, Italy, Ireland and Portugal have ran up huge debts mainly due to lack of earnings and huge spending.
The confidence in Greece's ability to pay up led a run on their bonds (debt). No one was willing to lend to Greece as they thought in case of a default, the institutions issuing the debt would loose their money.
If there was no Euro, and the Greece Drachma, the problem would have been limited to Greece, there would have been sympathetic noises made and the world would have moved on. Greece is part of the EU and has the currency Euro.EU cannot allow its member nation to fail in debt obligations, because that would mean the end of the Euro and the EU. No one would trust the Euro anymore.
The problem further stems from the fact, that the stronger countries like Germany were not too willing to bail out Greece. The reason? Taxpayers of Germany feel why should the Greeks party and we pay the bill for the party.
The same situation prevails in the other PIIGs nation. The following image got from the web, shows the magnitude of the debt.
The problem with the EU and the Euro is that it is an artificial nation and currency created without clear cut mechanisms, to cut fiscal deficits.
Now, how would this EU crisis affect other nations:
1. EU has 21% of the World's GDP. It is the largest trading partner to the countries like China and India.
2. A weak Euro hurts exports from India to EU.The margins get hit. If there is less demand in EU, the exports get hit anyway. Prime example our Automakers namely Maruti and Hyundai exports big volumes of cars to EU.
3. The Dollar Index has already moved up to 86 from 74. A strong Dollar means the end of the Dollar Carry Trade and the hot money moves out from the Emerging Economies and moves back to the US.

The next few months and how the EU crisis pans out will show us where our markets will go.
To think of it, it was only in last year where the talk was that that the Euro would replace the USD as the world's premier currency.

Saturday, May 8, 2010

Markets Next Week

As suggested in the last week's post, the Greek Tragedy did pose a shadow over the world. The Dow did a mid-week drama intra-day dropping 1000 points, the Ambanis had their day out in the court. It was an Action packed hot summer week. There are a few very significant cues happening which one should take note of.

1. The FIIs sold and sold huge. 4252 crores sold in May itself and last 3 days around 3600 crores. The rupee tanked from 44.20 odd levels to mid 45 levels. The FII money is what has led this rally. This year they have net bought around 4500 crores. The Dollar Index has moved onto 84 levels. A strong dollar means the dollar carry trade unraveling. The DIIs have bought around 12000 crores this year.

2. Gold has jumped to 1210 dollars per ounce. Gold ETF closed around Rs 1740. We have been recommending to buy Gold for past 3-4 months from around Rs 1600 odd levels. More the mess in Europe, more Gold prices will increase. Gold prices have been moving up in spite of a strong dollar.

3. RIL - RNRL judgment has gone in favor of RIL. RIL is a buy on all dips. Oil and gas is where the money is. Whenever market falls RIL should be accumulated.

4. The European mess is just increasing. Germany is being portrayed as the saviour of europe. If we think a bit, I would say Germany is more to be blamed for the mess Europe finds itself in. Why? China is being pilloried for a weak Reminbi which makes their exports cheap. Germany is having the same benefit. Weak Euro cushions Germany's exports at the cost of other EU nations. Germany has a trade surplus with all its partners. The Euro itself is a flawed currency and needs reform. Thanks to Germany, the other EU nations cannot export more and have to cut spending. The EU is signing up for a recession of several years.

5. EU in recession is bad news for the US and the globe. If they cannot export to EU, then a large market is hut out for them.

6. The Telecom Auction is going rake in the government about 50000 crores from 3G and around 15000 crores from the WiFi Auction. This would take the earings to almost double of 35000 crores projected. The Fiscal Deficit would be taken care of. The 2G Auction cost the people of India almost 30000 crores thanks to faulty mechanisms. No one seems quite concerned about.

7. The Dow dropped around 1000 points on Thursday intra day and then closed down 350 points. Again on Friday, dropped 150 points. So in reality it has lost 500 points on a closing basis in last 2 days. This means there is something which we do not know. There is no glitch but someone is indeed selling out. Someone big and someone who knows something which we do not know.

Technically:

1. We seem to be taking support at the trend lines from July lows right now.A break of that and next strong supports are at 4800 levels.


2. The 200 DMA at 4961 and 200 EMA at 4881 are supports.

3. Look at the 3 times, the Nifty as broke trend lie support from March 09 lows. Each time a break has yielded around 500 points. This time if this plays true we have a range of 4700-4800 as supports.


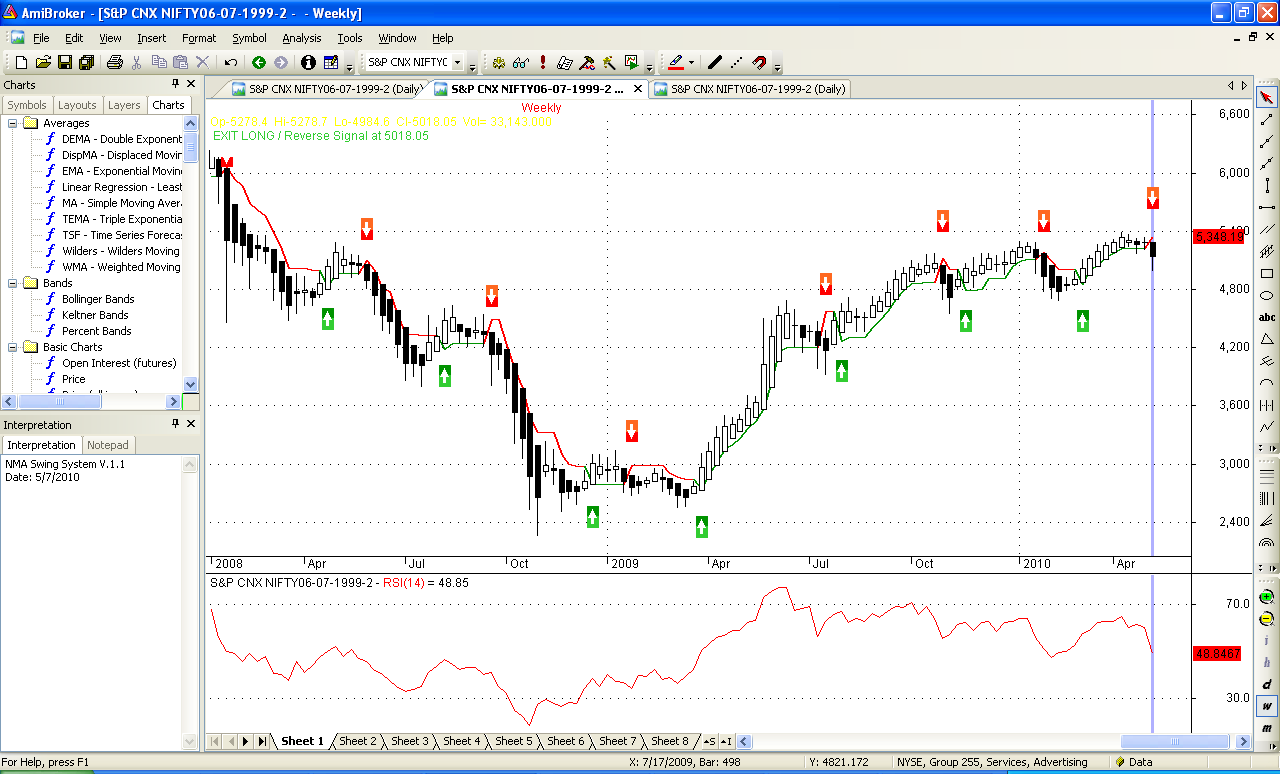
4. The Weekly NMA has given a sell. Typically a sell signals yields around 200 points more again taking us to 4800 odd levels.


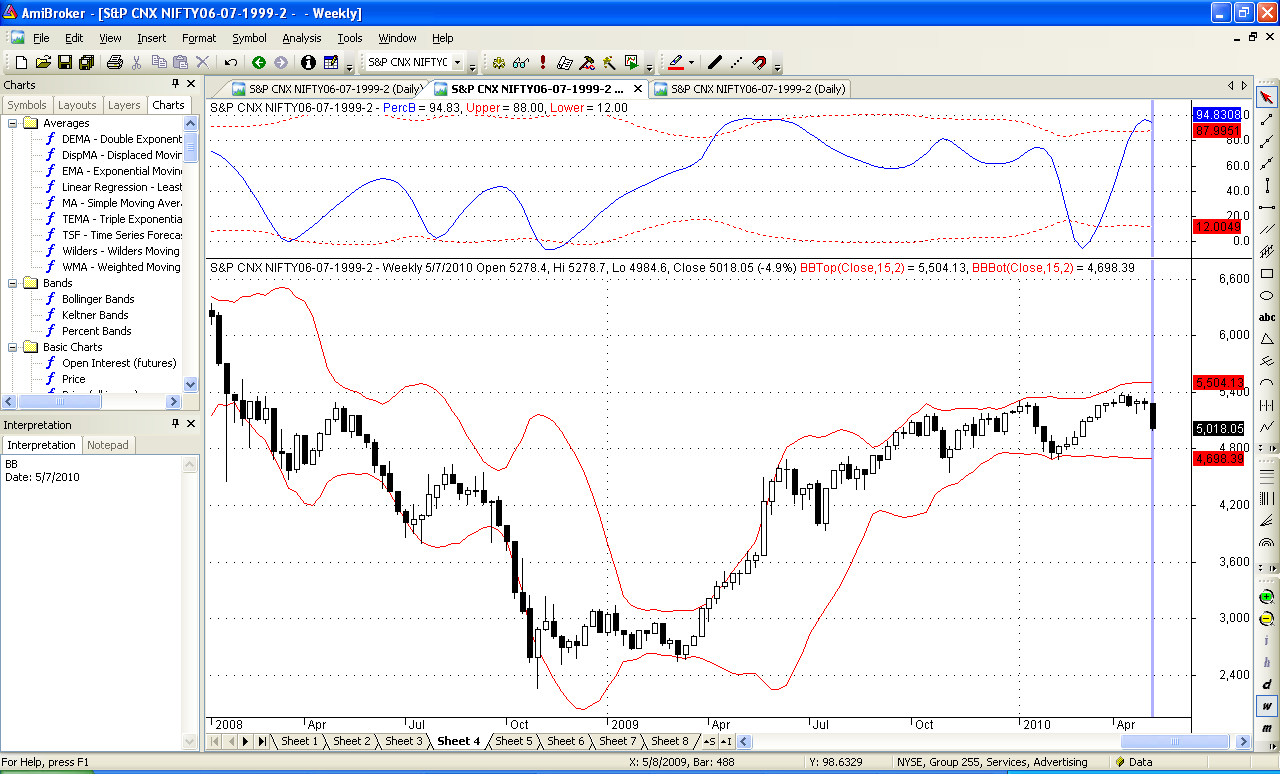
5. Look at the Weekly Bollinger band levels. From MArch 09, each corrections are taking us closer to the lower band.This very beautifully illustrates how the Rally is weakening. Supports at bottom are at around 4700 levels.


6. 4951 is the 61.8 % retracement level from 4675-5400.

In a nutshell, 4961, 4881, 4800, 4700 are supports. We can hope for some bounces above 5072, 5109.

Keep adding RIL and Gold at every dip.

Thursday, May 6, 2010

RIL-RNRL Judgement

Tomorrow is judgment day at 10:30 am. SO which way will it swing?

1.RIL wins
Why? Look at price movement in past 2-3 days. RNRL tanking and RIL steady and marginally positive

2. RNRL wins
Why? They won in High Court and SC might go with the arguments which swayed HC. Its always difficult to overturn a verdict.

3. Limbo
No clear judgment. This appears remote but we never know.

So technical say RIL wins and fundamentals say RNRL. Wonder which one wins?

Saturday, May 1, 2010

Three Downward Triggers to Watch For

As expected, the expiry happened around 5250. There are 3 major triggers to be watched over for the month of May. The old adage goes "Sell in May" and go for a vacation. We did not have the customary Jan-March correction so we are due for one in May.

The 3 triggers are:
1. European Sovereign Debt problems
2. 2G Auction scandal.
3. US Goldman issues.

Lets take them 1 at a time.

1. European Sovereign Debt issues.
It started with Greece and is spreading to Portugal, Spain and Italy. Spain has an unemployment rate of 20%. There have been ratings downgrades for Portugal as well as Spain. Things could spiral out of control pretty fast. Its not the first cockroach that causes the panic. Bear Stearn came out in March last year. It was Lehman in September that sparked the panic. Greece has been hogging headlines for 3-4 months now. The next country to go down will cause panic.

2. 2G scam
This makes Bofors look like a picnic. Bofors was 64 crores. 2G should be 40000 crores. The scam is simple. Issue spectrum in 2008 at rates which are of 2001 era and issue spectrum on first cum first served basis. The audacity is mind blowing and further the leaks which show that PM advice was ignored. The Telecom Minister should go and along with him the Prime Minister. Divestment total proceeds are marked as 35000 crores this year.
Its up to the Opposition to make the government pay.

3. US Goldman issues.
Goldman is the big daddy of investments in the US. Talk of criminal investigation and all makes people nervous. The way the markets tanked on past 2 Fridays gives a fair idea of what is to come.
This may be the weakest of 3 downward triggers, but cannot be ignored.

4. RIL-RNRL dispute verdict is expected to be out next week. I somehow feel SC will uphold the High Court verdict in favor of RNRL.

All in all, the reasons for the market to go up seem to be diminishing. Results are out of the way.Good monsoons can be one big trigger.
Gold hit all time highs at about 1182$. In rupee terms available at Rs 1670 per gram. This may be one last chance to get in at these rates.

Technicals.
1. 5200 is a very strong support. Multiple reasons to support this. Max OI is at 5200 put. It is a monthly pivot level. the 50 EMA comes around this level. The 5 week low ema which is often the last support is at 5189, as also the Bollinger Band bottom at 5189. I expect 1 more bounce from 5180-5200 levels to maybe about 5250-5270 levels before breaching those levels.

2. We are moving in a downward channel, with support around 5180.Breach of these levels should take us to 5050.


3. The NMA indicator has given a sell. It gave a sell, then a buy and now again a sell. Such see-saw happens just around a major trend change.

Saturday, April 24, 2010

Markets Next Week: Political Uncertainty

It was another week at the markets where news dominated the events. It was a crucial results week also with heavyweights like Reliance, Wipro and the banks came out with results.

Fundamentals:
1. Reliance came in with Results which were below street estimates. The profits for Q4 were expected at 5200 crores on an average consensus and between 4700-5700 crores. It came in at 4700 crores. More worrying was the fall in operating margins from 21 % to 16 % and the fall in refining margins. Wipro too came in with just about average results. HDFC Bank and ICICI Bank will come out with results today.
So far, the Results season there have been no major surprises or major disappointments.

2. The Goldman issue died down within 2 days. Greece is again hogging the headlines. The looks of it is that the cockroaches will start coming out again. The fiscal deficits of Ireland and Greece are in the range 12-14 %.

3. What the weakness in Europe means that the USD will strengthen and the Euro will remain under pressure. US markets will continue to outperform the other markets in the short term.

4. The Dollar Index has been going up from 74 to 82 in the past 6 months, but the rupee has strengthened to 44.50 from 48-49 levels. This is because of heavy FII inflows. What can reverse this inflow?

5. Political uncertainty has increased. The Opposition is presenting an United Front and the Government is veering from 1 disaster to another. From Naxal attacks to IPL Gate to now phone tapping. The Finance Bill is yet to be passed. The government is forced to make compromises with folks like Mayawati to ensure its passage. It has a strength of 271 members in a house of 540 members. The mandate of last year seems to be in the danger of being frittered away.

6. Forecast of a good monsoon is a positive. The weather department has not forecast even 1 drought in last 150 years. Till the rains come in, we can keep our fingers crossed.

Technicals:

1. The markets are consolidating in this range. The expiry is this week and lets looks at the Open Interest. Max OI is at 5300 strike price with about 68 lakhs puts and 64 lakhs calls written. Normally expiry occurs +- 50 points of max OI concentration. This gives an expiry target of 5250 - 5350.

2. Interestingly, trend lines support above theory. If you see the convergence of trend lines, they form a triangle at 5305. Upward breakout at 5325 and downward at 5265. This should get resolved by Tuesday.


3. Weekly charts suggest resistances at 5345 and 5370.


4. Break of downward channel comes in at around 5328 levels.


5. If we see the charts, a cluster of resistances comes in from 5325-5370 levels. 80 pc retracement comes in at 5352.

6. 5228 is a key sipport level as market made a bottom aorund these levels twice this week.

On the whole, things have just stagnated and for the markets to go up, the negative newsflow has to stop. I do not see the markets going up unless the controversies stop.

The current week should resolve this dilemma one way or the other. The expiry week can also increase the volatility. 5258 - 5332 is the range. Break can give us 5400 or 5200.

Saturday, April 17, 2010

Action Packed Next Week in Store

We have a potentially very eventful next week coming up. The Goldman Sachs scandal on Friday after our markets closed and the RBI Credit Policy on Tuesday set things up for big moves. Lets evaluate in detail all the fundamental and technical aspects so we are well geared to meet the markets.

Fundamentals:
1. Goldman Sachs (GS) have been accused of Fraud by the SEC. This is a very serious allegation and GS will not take it lying down. The clout of GS can be seen by the fact that the previous Treasury Secretary of the US (their equivalent of our Fiance Minister) was the Head of GS.

2. 2 things can happen. It is a storm in a teacup like Dubai, due to which the markets tank for a day or 2 and recover. If it is a prolonged affair, then this might potentially trigger a bigger fall. The timing of the announcement is also suspicious. Friday, after which the markets are closed for 2 days. This might be an effort from the Obama camp to project himself as the White Knight in Shining Armour who takes on the Big Dragon from Wall Street.

3. The RBI Credit policy on Tuesday. It is expected that a Repo and Reverse Repo hike of 50 basis points. Anything more will trigger a slide like a CRR hike of 25 basis points. This will impact the liquidity immediately.

4. The past week, the market has been ignoring good news. Infy good numbers, good IIP data, inflation just below 10 pc and the markets still went down. When markets ignore good news, then one has to be careful.

5. The Results season will be in full swing. Any negative surprises will not be digested as good results are already factored in.

Technicals:

1. The trend line giving support from the Feb low of 4675 is broken. This may been the current up-move is over.

2. The Nifty has been moving in a downward channel for the past few days. Support comes around 5250 break of which opens a target of 5150.


3. 50 EMA comes at 5167 which should provide some support. The 5 week low EMA which always provides support also comes in at 5195.

4. Looking at Retracement levels, supports come in at 5229, 5123, 5038, 4952.

5.As per Elliot, the 5th wave might have been over at 5400. Length of 725 points. (Refer last post).

6. The Entire bull run is only in danger below 4800 where the 200 day EMA is and also the entire upward channel from November onwards ends.

7. Bollinger Band support comes in at 5190.


I would still continue to add Gold and wait for next 2 days to get over to decide next course of action. All shorts should exit above 5274.
5150-5190 is a support zone for the markets.
If any stock is to be added then it has to be Reliance. The reasons are high crude prices and in case of a fall, this stock will fall the least.

Friday, April 16, 2010

Moving in a Downward Channel


Have a look at the chart, we are moving in a downward channel.

Upward resistance at 5363, downward support at 5265 approx. Break of channel would give approx another 100 points.

5180-5200 multiple supports, not a bad idea to book profits once.

Saturday, April 10, 2010

All Eyes on Infy Results

1 more week of gains and Nifty closed at 5362 for the week. The Result season is upon us and Infy will kick off proceedings on 13th April with 14th April being a holiday. What to expect from the Results?

1. The rupee has strengthened to 19 month high of 44.29. This will impact the IT companies earnings.

2. The Steel makers, automakers, cement makers should post good results.

3. Oil prices are at 86 dollars already. A further rise would start affecting the economy. The rupee has gained 10 pc in last 2 months or so. This should cushion the high oil prices. If the prices move to three digits then we start having a problem.

4.Bond yields are hovering around the 8 pc mark and high inflation makes another round of rate hikes inevitable in the credit policy on April 20th.

5. Gold has given a breakout in dollar terms. It is just 5 % below its peak price of 1225$ per ounce. Thanks to a strong rupee, it is 9.5% below its peak price. Gold-Oil has a ratio usually of 15 barrels to 1 ounce of Gold. Right now, the ratio is 13.5. If oil moves to 100 dollars a barrel, the fair price of Gold would be 1500$ per ounce.

6. As the days goes by the risk reward continues to become more unfavorable for owning equities. Markets do not go up forever. We had this rally for 9 weeks and rallies usually last 10-12 weeks in this post March'09 rally.

7. I had given an Elliot wave post here:
http://money-manthan.blogspot.com/2010/01/markets-is-top-in-place-or-can-we-still.html

Slighly modifying it:

If we take rally after the budget from 3918, we can see 4 clear waves:

a. Wave 1 - 3918 to 5181 (1263 points)

b. Wave 2 - 5181 to 4539 (642 points) approx 50% correction

c. Wave 3 - 4539 - 5310 (771 points) Wave 3 is 61% of wave 1.

d. Wave 4 - 5310 - 4675 (635 points) approx 82% correction

e. Wave 5 will unfold 4675 - ???
This has to be less than 770 points as 3rd wave cannot be shortest, the target comes to 5445 max.

I would simply stick to adding more Gold right now and keep a trailing stop loss.

Thursday, April 8, 2010

Short Term Reversal?

The Markets corrected today to close at 5304. This may be a short term reversal as the markets made a lower low and lower high after a long time and also closed below critical levels.

Supports are at 5245-5260

Resistances at 5328-5370

I am following an automated system of generating calls which is still at experimental stage. I am updating the signals at the top left hand corner in case anyone is interested in reading them.

I have been testing for 2 weeks and find that generally the signal give 50-100 points minimum.

US has also corrected yesterday. Time to be careful in the near term.

Sunday, April 4, 2010

Nifty P/E and Dividend Yield

This week lets look at 2 interesting ratios Price to Earning Ratio and the Dividend Yield of the Nifty. I have plotted the graphs from 1999-2010 taken from the NSE site.

1. Price - Earning Ratio.
This is nothing but the Market Price divided by the Earnings per Share or the Profits made by the company. This helps us identify how expensive the market is.
In the bubble peaks made by the market in 2000 and 2008, it had touched almost 28. In the bottoms made in Jan 04 and Mar 09 it was near 11 and Sept 01 around 12. Whenever the market has tumbled from P/E of 28 or rallied from 10-12 P/E it was a major top or bottom.


The market is currently around a P/E of 22.05. In Feb 01 when market tumbled from a P/E of around current levels it came to a P/E of around 13 again. On subsequent occasions it stopped its fall in a range from 12 to 15.
Now the EPS is Rs 234, after another 2 sets of quarterly results by July, assuming a gain of 6 pc, the eps should around Rs 250.
This gives a Nifty range between 3000 and 3750. This would coincide a retracement of 50 to 76 % of the rise. The figures would look speculative right now but the graph gives a perspective of P/E range.

2. Dividend Yield
Dividend yield is nothing but if we take dividend as a percentage of market price.High dividend yield means the stock price is low and vice-versa. This is inversely proportional to price of Nifty. When nifty is at highs, dividend yield is at lows and vice versa.


In 2000, the yield bottomed at 0.62, in 2008 at 0.88 and currently we are 0.93. Remember in 2000, we were in the dot com boom, hence IT stocks which give low dividend compared to price were at the top. For a dividend yield of 0.88, market would trade at around 5550 or 18500. We are not very far from that.
The yield tops out at 1.7 to 2. The dividend earning now is at 4919.Assuming a earning of Rs 5200 by the time we bottom out, Nifty would come to a range of around 3100

Both the above studies, simply indicate we may be near the top and give a range of the fall to follow.Of course, we could simply discard the 8 year cycle go on to make another peak at Nifty P/E of 28 translating to Nifty 7000 and then crash big time.

Lots to ponder about. Its your money, make informed decisions.