Saturday, December 25, 2010

Market Direction: Technical Point of View

Its a long time since I did a study on purely technical analysis.Now, is a good time to focus on pure Technicals. Lets have a glance at e few charts below.

1. Lets look at at an indicator which Shail and I have did a study of. Its the difference between 5 DMA and 20 DMA of the Nifty. Right now it is in positive territory and touching the resistance line of the previous peaks. Any close above 6025 and this trend line gets broken upwards. A clear breakout.


2. The 50 DMA is at 6018. Have a look at the past record. Whenever it has been broken on the upside or downside, there has been a substantial move. This is the first time since the rally started in March 2009 that it is trying to make an up move after being resisted once. So, if we move convincingly above 6018, up we go else we are in for a major correction.


3. There is a cluster of supports around 5950. The 20 EMA, 50 EMA, 5 day low Ema. This values should be kept as strict stop losses on the lower side.


4. The Bollinger Band indicates a resistance around 6067 which was the previous top. This rally has been very slow and retracement has taken a longer time than the fall. All this makes the rally suspect.


5. In case of a fall, Gann fans indicate support around 5600 and resistance around 6600.


6. Considering Fibonacci levels, the resistances should be at 6047, 6070, 6106, 6215. Beyond 6215 we are going for new highs.

7. The daily stochs have given a sell signal. These are leading indicators. The correction can be up to 5950 or deeper levels.


Strategy in a nut shell, long above 6024 and short below 5950 levels. In between, just watch the fun.

Sunday, December 19, 2010

Its Vacation Time

This was a truncated week for the markets. The Nifty moved up by 1.6 pc, the FIIs remained net sellers and there are expectations of no major moves in the holiday season. But, stock markets are known to surprise and we never know what is in store. Lets examine the fundamental and technical factors at play here.

1. On the Domestic front, the the 2G scam got murkier, the CBI made a show of taking action.What could queer the pitch if A Raja actually gets arrested next week. There are 2 possibilities if this arrest is made. One is DMK drops Raja like a hot potato and life goes on. I feel this is more likely because elections in Tamil Nadu are just round the corner in May 2011, and the DMK needs the Congress as much as the Congress needs it.Breaking the alliance would immediately reduce DMK to a minority government at the State level and a hostile Jayalalita is waiting in the wings. On the other hand, if the DMK withdraws support the markets will go for a toss.
2. Industry leaders like Deepak Parekh and Rata Tata have openly come out and voiced concern over the phone tapping.This is the first time, that senior industry voices have raised their voices against government policy. This only underscores the seriousness of the issues in debate. The FIIs are only concerned on the return of their investments. As recent data has shown they may withdraw the capital at the slightest whiff of trouble.
3. The Korean peninsula is the joker in the pack. North Korea has issued an open ultimatum to S. Korea,, that if they go ahead with the war games, there would retaliatory attacks. One never knows where this will all end in.
4. Europe remains in a state of flux. The Spanish bond yield in comparison to the German bond yield, the spreads have widened. These spreads are usually the first indication of trouble.
5. The advance tax numbers have been good, but that is history now. Crude oil has been consistently trading in the 85-90 dollars band. 100 dollar crude is now a reality. The harsh winter in Europe will not help cooling down crude prices either.This will lead to further fuel price hikes, spiraling inflation and rate hikes by the RBI.
6. The spate of lending rate hikes and hike in the fixed deposit rates are a sure sign that the rate hikes by the government are beginning to hurt the Banks bottom line.
7. Nifty Open Interest shows strong support at 5800 and strong resistance at 6000. I would watch the 6000 levels very closely as above that, a fresh leg of up move is on the cards. Short below 5875 and long above 6000.
8. I am bullish on gold, crude, government FPOs and bearish on banks, automobiles.

To sum it up, expect range bound movement, a big fall in case of unexpected news and the action to be played out in Jan. The selling by FIIs caps the upside. Decembers have been generally positive months for the markets over the past so many years. The year end bonuses are decided on the NAV values.

Friday, December 17, 2010

Risk Management and Investing

I had written a guest post for Subhankar.

In this month’s guest post, Nishit covers the related topic of Risk Management. Properly assessing and understanding the risks involved in one’s investment plan and taking appropriate steps to mitigate those risks helps in formulating a proper asset allocation plan to suit one’s individual investment style and risk tolerance level.

-------------------------------------------------------------------------------------------------------------

One of the most important topics that every person who makes any investments should be aware of is Risk Management. A good investor who is poor at Risk Management can get wiped out. Let us try to define risk and risk management
http://investmentsfordummieslikeme.blogspot.com/2010/12/risk-management-in-investing-guest-post.html

Saturday, December 11, 2010

Uncertain Times in December

This was a roller coaster week for the markets and the markets lost 2.3% of the index value. There were certain takeaways for each of us, which if adhered will save us a lot of money if not make money. Lets examine the key events for the markets.

1. FIIs were net sellers each day of the week. The selling intensified as the week went by and at the end of the week they had dumped almost 1 billion dollars worth of stocks.

2. Even though the Indices declined only 2.3%, the broader market was butchered. Have a look at today's Economic Times and see the number of stocks hitting 52 week lows as compared to hitting 52 week highs. Broader markets are usually leading indicators.

3. Gold is sustaining on a closing basis near its all time highs. That means people's perception of risk has increased. It could also mean those people who know are buying gold as a hedge. Europe remains a wild card and we do not which economy will need a bailout next.

4. FIIs always hedge in the Futures and Options market. So, they make money even if market is falling. They may well retain their equity holdings, make small paper losses here but make handsome profits on their derivative trades. remember its the money which counts.

5. The political storm is intensifying with new cockroaches coming out everyday. The Telecom scam may well take Manmohan Singh with it. It may sound ludicrous now but the government needs to regain the moral high ground.Manmohan Singh has enjoyed power for 6.5 years and made a place for himself in history. Exit Manmohan enter Pranab?

6. The Technicals are badly shattered. Next support for me, looks to me 200 EMA at about 5560.

7. If we take Elliot and wave 1 was from 6339-5690 = 649 points. Wave 2 from 5690 -6070 = 380 points. Looking at this, the targets for Wave 3 could be 5421, 5096, 5020. We may be about enter wave 3 of 3, the most dreaded wave with a devastating gap down also possible.

Its the time to focus on preservation of capital. Gilt funds, gold, bank FDs are what I would look at now.I would also keep cash in hand to invest in blue chips at lower levels.
A close above 6000 levels in Nifty and we are again moving up.

Sunday, December 5, 2010

Posts from Shail

I am happy to say that Shail will posting as and when his schedule permits him to post. Shail, is one of the technical analysts whom I greatly admire for his out of the box thinking. I again ventured into TA with Shail's help. Lets enjoy his posts.

INR movement v/s Indian Equity


The two charts shown above illustrates the correlation between INR and S&P CNX Nifty from jan 2007 onwards, this clearly indicates that stronger rupee shows bullish sentiments of FII, although now DII also contributes significantly, in to Indian capital market.


The bar chart below shows the net FII inflow in Indian capital markets in the same period which partly explains the stronger or weaker rupee in the period of study. Although the value of rupee depends on many factors including Global currency trends, Oil prices as India is a big importer of petroleum, RBI policies and off course political factors this study mainly deals the change in rupee with respect to FII movements.

FII have started selling in huge quantities starting nov 2007 till October 2008 thus contributing to the weaker rupee. Technically rupee has strong support at around 44 levels this may indicates that net FII inflows are capped and at 44 levels FII out flow dominates the inflow. Same is visible in the chart above during April – may 2010 and Nov-2010.

We can conclude that the market rises with increase in FII inflows it could be long term or short term, This helps in stronger rupee even when the GDP is not so strong like the case in 2008, but this also means that if no FII flows coming in then the markets may have already made a top or some more correction before they make a new top.

Saturday, December 4, 2010

Wikileaks: Impacts and significance

This week the world was rocked by the Wiki leaks expose of American Diplomatic cables by the now now (in) famous Wiki leaks expose. What is wiki leaks and what is its significance?

To skip re-inventing the wheel, have a look at the wiki site below:
http://en.wikipedia.org/wiki/Julian_Assange

Now, lets see the ramifications. In the short term, the expose of the diplomatic cables and confidential information being shared in the public domain is just a small event making headlines. The basic gist was the expose of US secret moves and name calling of its allies. The French President was called as the Emperor with no Clothes. All these revelations in the short term offer nothing much except provided entertainment for billions of bored readers worldwide.
The real ramifications lie in the long term perspective. The only strength the US has its dollar and its numero uno status in the pecking order worldwide. Such damaging comments about its double standards with its allies will lead to an erosion of trust amongst its allies. The shift will be gradual not visible in a day, month or an hour. Often, small seemingly insignificant events lead to big catastrophes.
The assassination of Archduke Ferdinand lead to the first world war.

http://en.wikipedia.org/wiki/Assassination_of_Archduke_Franz_Ferdinand

That event was not the main cause. The ground work was laid years in advance. It was a small match which lit the bonfire which consumed the world.

The disquiet amongst its allies may eventually lead to the dollar not being the Numero Uno currency in the world. This may be next month, next year or next decade for all we know.

The wiki leaks are significant in the sense they can be the beginning of the end of the American dream. Each nation usually leads the world for a century or two. First it was the British, then the Americans after the World War 2, now we await the rise of the new axis of powers.

Us has to adjust to the new world reality that they are not the first nation of the world but first amongst equals. If they string together an alliance of allies they can cling on for few more decades. The writing is on the wall. Its up to the US to read it.

The Korean exchanges, the Iranian Nuclear stuff can all be just small events in a cycle unfolding which leads to a new world order.

Julian Assange is both a hero and a villain. Hero for making the information public. Information is the right of every world citizen. Villain for making statecraft secrets public. History will judge Julian Assange. It is also said History is written by the Victors.

Thursday, December 2, 2010

Introduction to Options - Part 1

Options are one of the most lucrative ways of making money in the markets. The flip side is that they can lead to huge losses if not dealt with correctly. Let us explore the world of options. To begin with there are 2 type of Options, Put option and a Call Option. Put Option gives the buyer to sell a stock or index at a particular strike. It gives the buyer the right to sell at a particular strike price but not the obligation to sell. It is similar to taking insurance on your house or car. Buying a call option gives the buyer the right to buy a stock or index at a particular price but not the obligation to buy the underlying. It is similar to giving a deposit amount to buy a house at a particular price.
Options are of 2 flavors. The American Options and the European options. The European Options can be exercised only on expiry day whereas the American options can be exercised on any day till expiry. In plain English, it means though you can buy sell these options every day as per market price of options, the actual difference between market price and strike price can be got only on expiry day for European Options and any day till expiry for American Options
Example:
1. Nifty 6000 CE Nov 26 is trading at 70 rupees and the underlying index is at 5950 with 10 days to expiry (Strike price 6000, Call Option, Flavor European)
What this means is I believe the Nifty will go much higher in the next 10 days and will expire say at 6200. On the day of expiry I will get 6200-6000 = 200 rupees. My net profit on the trade is 200-70 = 130 rupees. Now, let us assume the market falls to 5800 instead of going up. I will end up only losing the premium I paid.

2. Nifty 6000 PE Nov 26 is trading at 70 and the underlying index is at 6050 with 10 days to expiry
What this means is that I believe that Nifty will go down in the next 10 days and will expire say at 5800. On the day of expiry I will get 6000-5800 = 200 rupees if the Nifty expires at 5800. My profit is 200-70 = 130. Now, if against my expectations if the markets move up and expire above 6000, I end up losing only the premium paid.

Now, we have learnt what options are. There are 4 possible things one can do with Options.
1. Buy a Call Option
2. Sell a Call Option
3. Buy a Put Option
4. Sell a Put Option
What does all this mean? Buying a Call or Put Option means that we have the right to buy or sell an underlying stock or index at a particular strike price. The loss is limited to the amount of premium paid. Selling a put or call option means we are open to facing unlimited losses or profit if the market moves opposite to our direction.
1. Nifty 6000 CE Nov 26 is trading at 70 rupees and the underlying index is at 5950 with 10 days to expiry.
Now, I sell the 6000 CE option as I believe the markets will move down. So, if the expiry is below 6000, I pocket the entire 70 bucks premium. If my direction goes wrong and market moves to 6500, I have to pay 6500-6000 = 500 rupees to the option buyer. My net loss is 500-70 = 430 rupees

2. Nifty 6000 PE Nov 26 is trading at 70 and the underlying index is at 6050 with 10 days to expiry
I sell the Put Option because I believe the markets will go higher in the next 10 days. If they expire above 6000, I pocket the entire 70 rupees premium. If my direction goes wrong and market crash to 5500, I have to pay 6000-5500 = 500 rupees to the buyer. My net loss is 500- 70 = 430 rupees.

From the above examples, we can see buying options, the loss is limited and profit is unlimited. Selling options, profit is limited and the loss is unlimited. Yet, it is more lucrative to sell options rather than buy options. Why is this so? Let us look at this in my next post. I plan to write a series of posts every month which would take us from the basics of options trading to complex strategies.

Sunday, November 28, 2010

Worry Clouds on the Horizon: The Big Picture

Over the last few weeks, several events which have occurred which are a reason to ponder over if not outright worry. Fundamentals do not change overnight but are a work in progress and suddenly one day the symptoms become apparent to all and the trend changes. The build up to such a trend change takes a long time.

Global factors:
1. The US came up with the QE-2 program of pumping in 600 billion dollars. This just confirmed the worst fears that the US dollar will be toilet paper sooner or later. Aything in excess is bad and excess dollar printing debases the value of the dollar. The only thing holding up the dollar is its safe have status. It just needs 1 event to trigger panic and have the world lose faith in the dollar. The event could be anything, war, economic collapse, trade wars.
2. Gold is the only safe haven. QE-2 demonstrates that. The price of gold has accordingly behaved the same. It has stayed above its previous peak of 1280 dollars for quite a few weeks.
3. Europe is in a bigger mess. Greece is gone, Ireland is gone. Portugal will be next and then Spain. As the economies get bigger, the bailouts will extract a bigger price. Spain bailout may well test the future of the Euro. Countries like Germany simply cannot continue to enjoy the advantage of a weak euro aiding their exports and not take the pain of supporting the weaker economies.
4. Japan is already talking of currency wars as their strong Yen is hurting their exports. China with its weak Yuan policy is already adding fuel to the fire.
5. Conflicts like the Korean are just small blips on the horizon. A conflict will hurt all parties concerned. Its mere shadow boxing. If it goes out of control, then we have a problem on the hands.

So far, the global crisis was a selling point for the Indian story of growth and 9 pc GDP. Over the last few weeks, the series of corruption crisis have severely dented Manmohan Singh's credibility.
Local:
1. The 2 G scam siphoned off huge sums of money from the Nation. What is even more worrying is the brazenness of those involved. The JPC probe demand is justified and necessary. JPC is answerable only to the Parliament and can summon even the PM. If the Congress has nothing to hide, why create such a row over JPC.
2.Adarsh scam has indicted the defense establishment. The judges of Allahabad High COurt are also under scrutiny. So far, it was an established fact, that politicians are corrupt, now the malaise is spreading to the pillars of the Indian society.
3. These events do not have an immediate impact. They have a domino effect and one day the Dominos fall.Already, Transparency International has lowered India's rating by 6 places. TI is a world renowned anti-corruption watch dog.Many MNCs base their decision to invest in a country on these ratings.
4. Victory of Nitish Kumar and its margin suggests the electorate supports good governance. Gujarat is also one more example of good governance. 9 pc GDP growth cannot be taken for granted. As I see, Congress may well lose the 2014 elections. Remember in 2004, Congress was written off. Similarly, history could repeat itself and NDA may well make a comeback with a reduced role for the BJP.
5. The FIIs have just withdrawn 4000 crores, less than a billion dollars and the markets have fallen 9 pc. This doesn't speak much of the depth of Indian markets. If FII selling intensifies, markets will just collapse. What is especially worrying is how midcaps have just collapsed. HCC from a peak of Rs 81 to Rs 40, loss of 50 pc and several more companies have fallen similarly. Just open Economic Times to see the number of companies making 52 week lows.
6. This butchering of the midcaps is what sets this correction apart from other corrections since Mar'09.
7. We may well have 1 more round of up move left. Caution bells are ringing loud and clear. Its time to take profits off the table, and also invest only in blue chips if you must.
Bullish scenario:
Bull markets end with a big bang. Remember Jan 2000 and Jan 2008. This time the fall is channeled, so just a correction.
Bearish scenario:
Sentiment has gone bad. Mid caps slammed. This normally doesn't happen in simple corrections.

Sunday, November 21, 2010

Expect a bounce ahead

It was a week of losses at Dalal Street but are things as bad they seem to be? Let us try and explore.

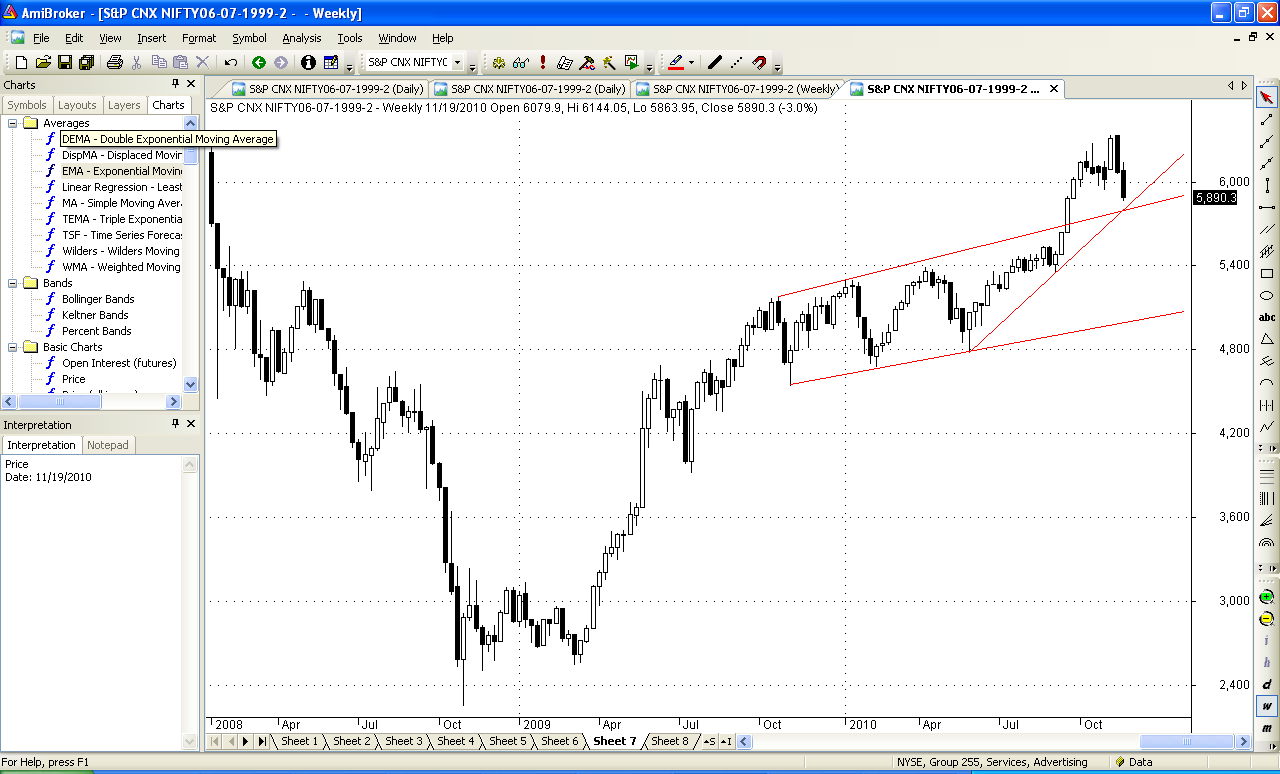
1. The markets lost about 3 pc to close at 5888.DIIs bought worth 865 crores and the FIIs bought worth 32 crores. Now, this can be interpreted in 2 ways. Markets fell in spite of 2 pillars not selling indicating shallow market. Else, it was operator driven selling.

2. We have trend line supports at 5803, 5830. These are very important supports as breaking this we enter the previous channel and 1 trend line is line joining lows from March 2009.


3. 5960 becomes a very key level as 5 week low ema and 5 day low ema is around this point.


4. The Bollinger band has touched the lower line after touching the upper band implying a bounce is possible anytime soon.


5. Ireland crisis seems to be over, 2G is settling down. Even if we have hit the top, expect a corrective upmove to 6045, 6101, 6156.

Corrections are part and parcel of trading. One should follow the trend for trading. We are near key supports and expect at least corrective bounces any time. We have now fallen for about 9 sessions and usually all falls are for 8-11 sessions.