Last week, the markets gave indications of being week as per the Technical Analysis. True to form the Markets took a dip on Monday and then bounced back smartly. This week, the pattern formed is exactly reverse its showing an up move. So do we have a top on Monday.Lets look at a few charts.
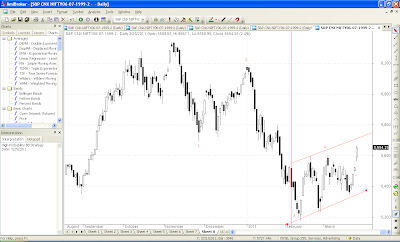
1. There is an upward channeled move going on with top around 5720-5750 and bottom around 5340-5360. Breakout on either side could give moves of up to 400 points minimum. This can also be called a Bearish Flag. It is a Continuation Pattern and happens during down moves. Lets watch the channel.So if 5750 breaks we may move to 6150 else if 5350 goes down to 4900.
2. If we connect the tops from 6339 to 6177, resistance comes at 5900 right now.
3. I am almost sure a 5 wave down move got over at 5177. So wave 1 was 6339 to 5177. ow we are in Wave 2 correcting the entire down move and targets could be 5629 (done), 5758 or 5895.
If the above assumption is true, then April can have a range between 5350 to 5850 before we commence a sharp down move of about at least 1200-1300 points targeting Nifty 4500 by June end.
Fundamentals:
Well nothing has changed. Crude is boiling, Interest rates are rising and so is Inflation. 1 good buy on NSE is L&T Debentures which have 8 years left to maturity with Coupon Rate of 10.24 pc paid twice a year. Bonds are trading at Rs 1025 on NSE. You can lock in 10 pc Interest Rates for 8.5 years. No FD is offering that and liquidity is you can sell on NSE and get the principal back in 2 days.
We work hard for our Money. Does our money work equally hard for us? Let us explore the world of financial markets together.
Sunday, March 27, 2011
Sunday, March 20, 2011
Markets: Technically Ahead
The Markets took a sudden dip on Friday. Will they break out of the 5300-5600 range. It has been totally range bound for the past few weeks since the budget. I studied a few technical indicators and all of them seem to showing the markets headed lower.
1. The NMA Indicator is a pretty reliable indicator. The Daily is in Sell Mode and the Weekly well as never given a buy signal from the previous sell signal.
2. The 5 days moving average minus the 20 days moving average has been pretty reliable. It has give the Sell sign by going on a reducing trend.
3. The trend line indicates support around 5320 levels.
4. The Bollinger Band gives us support at 5300.
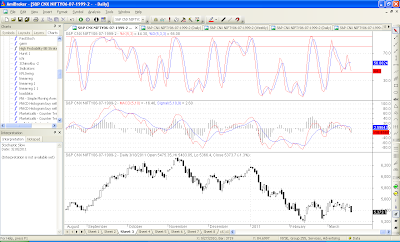
5. The Daily Stochs and MACD are in sell mode. MACD has just moved into negative territory. A move into negative area usually gives a substantial negative movement.
6. I have made some Elliot labeling. As per labeling, if wave 5 began at 5608 we are headed to 5000 on the Nifty or 16635.
To sum up the Technicals, I would watch 5300-5320 area closely. A close below 5308 would open up downsides to 5000.
Thursday, March 17, 2011
Using Earnings Yield (E/P) to time the investments
We know the basic ratio of P/E. I have taken the inverse of it also known as Earning Yield and compared it with the G-Sec Yield. Below is the guest post I have done for Subhankar.
Continue Reading at:
http://investmentsfordummieslikeme.blogspot.com/2011/03/using-earnings-yield-ep-to-time-your.html
Continue Reading at:
http://investmentsfordummieslikeme.blogspot.com/2011/03/using-earnings-yield-ep-to-time-your.html
Sunday, March 13, 2011
Key Pointers for the Week Ahead
The Markets lost 1.7 % over the week to close at 5445. The current week is crucial due to the RBI policy Meeting on the 17th of March as well Advance Tax figures due to be out. Lets examine what can drive the Markets this week.
1. the Advance tax figures for various companies will be out by the 16th. Expect them to be sluggish due to higher input costs over the past quarter.
2. The RBI Policy review on the 17th March should hike rates by another 25 basis points. Anything more ad the markets will react.
3. The Oil companies continue losing money due to under-recoveries. Petrol under-recovery is about Rs 4 and Diesel about Rs 11. Expect another round of petrol price hike. Diesel price hike can be ruled out due to upcoming elections.
4. Japan has suffered heavy losses in the earthquake. This may lead to debt raising by the Japanese government for re-building efforts. The Sovereign Debt crisis of the EU countries can raise its head again anytime.
5. We have spent about 30 trading sessions below the 200 DMA thereby almost confirming the start of a new bear market. Since Mar'09, we had gone under 200 DMA just once in May'10 and that too for 7 trading sessions.
6. The market is presently in a no trade zone. Decisive breakouts only above 5608 and below 5309, the post budget lows.
7. For the month of March, the FIIs have bought 11 crores and DIIs have bought 200 crores. This has resulted the markets moving up by bout 2 pc. We could see the quarter end window dressing of the Mutual Funds book, so expect the listless trading to continue unless something majorly negative comes up.
As we look at it there no major positive triggers to take the markets up from here and no major negative triggers right leading to a crash like situation. Decisive moves will be seen after Thursday and also as more evidence of damage to Japan gets uncovered.
Sunday, March 6, 2011
Key Week for the Market
The Markets are based at a key turning point. The budget has come and gone. It was a nothing budget treated as a positive budget by the markets grasping at straws.Gold hit new highs, crude boiled over and the DMK Ministers pulled out of the cabinet.
1. The DMK pulled out of the government and will give issue based support. What this means in plain terms is that this is a lame duck government. They have outside support from Samajwadi and Mayawati which will keep them afloat for now. The ability of government to push through reforms gets limited now and this will be a trigger for the FIIs to lighten up on India.
2. Brent crude at 116 dollars. Under-recoveries on Petrol at Rs 4 and Diesel at Rs 11. The economy is going to start hurting. In 4 months, Petrol has moved up from Rs 48 to Rs 63. Inflation will continue and high interest rates will hurt the economy.
3. Gold has given a breakout on charts. It hit a fresh all time high of 1441 dollars and closed on Friday at 1432 dollars. 1432 dollars was the previous all time intra day high. Closing above previous intra day high on weekly basis is a very bullish close. Next target would be 1500 dollars.
4. 15 barrels of oil = 1 ounce of gold. So, if oil continues at 120 dollars a barrel, gold should move to 1800 dollars an ounce in next 3 months.
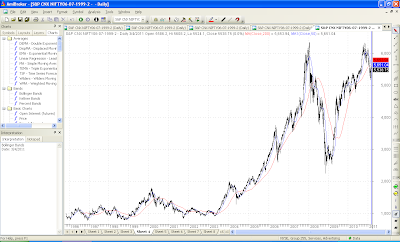
5. The Death cross has happened. This is for both the Moving Averages and Exponential Moving Averages. This is when the 50 EMA crosses the 200 EMA on the downside or 50 MA crosses the 200 MA on the downside. This is a very significant downside crossover signaling start of a bear market. The markets may not collapse overnight but a long term bear market starts. Looks at the crossovers they have been clean and this is the first time since Mar 09 we have got this crossover.
6. Libya seems to be i for a prolonged stalemate. This is bad news for crude oil as prices will continue to be at highs.
To sum up, we have bad news on political front, India imports 70 pc of crude oil which is at highs. We have bad news both on the domestic as well as foreign fronts. Charts had signalled a decline long back and this is just news catching up with the charts.
Subscribe to:
Comments (Atom)


