Sunday, December 25, 2011

Holiday Season Kicks in


The markets recovered from the early week blues to settle about 1.3 pc up and close the week with mild gains. The coming week is the expiry week and there are several reasons why the markets will close up for this week too.

1. It is the time for the year end bonuses and NAV reporting hence I do not expect any weakness i the markets. US and European markets are closed on Monday, thus giving a field day to the operators to take the markets up a bit. All in all it should be a flat to a positive week ahead.

2. Expiry should be above 4700 and closer to 4800. This is what the Open Interest data is suggesting. 4700 calls were unwound early on in the week giving an indication of the road ahead.

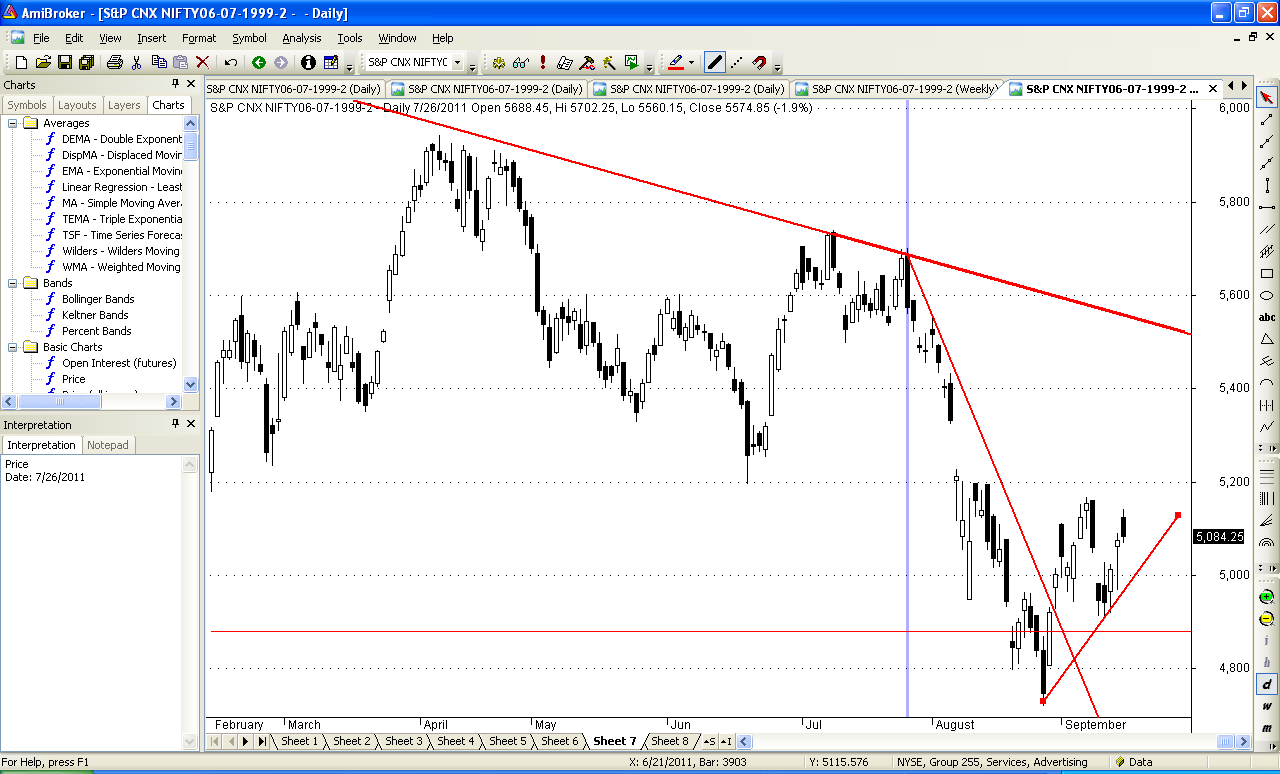
3. Taking Elliot waves into consideration, this could mean Wave 1 from 5400 ended at 4532. This could be an alternate count. If this is true then we are in for an up move of a couple of weeks and the markets could test 5050-5100 band again.
If we go by the original count,
wave 1 was 5400 - 4720 = 680 points
wave 2 was 4720 - 5099 = 379 points
wave 3 sub wave 1 ended at 5099-4532 = 567 points
Wave 2 should end at above 4815, 4882

Wave 3 sub wave 1 took about 9 days and the up move should end in about 6 to 7 days out of which 3 days are done with.This shows the up move to continue till about this expiry.

Now the last up move was 379 points. 4532 + 379 = 4911. Any move above this indicates that this up move will continue for longer than expected and it was wave 1 ending at 4532.

4. 4800-4810 has both the 20 EMA and 20 SMA which would act as resistance. It is also the 50 pc of retracement of fall from 5099. This makes 4815 a very significant resistance.

5. The overall trend is down and bounces could end in the range of 4900-5100. Only a break of the trend line joining all tops from 6339 which comes between 5250-5320 depending on which time frame one selects can signal a new bull line.

6. The dates for the elections in 5 states are out. Expect policy paralysis to continue till the end of Feb.

7.Anna Hazare agitation kicks in from Dec 27th and also the Lok Pal bill will get introduced in Parliament on that day. This can be a dampener for the markets.

8.Muthoot NCD has got an attractive rate of interest of 13.25 %. This is an interesting offering. On the face of it, looks pretty good. 2 years is not a long time frame and also Muthoot have very low NPAs of 0.58%. They will offer you Rs 64 rupees loan if you pledge gold worth Rs 100. This also means even if gold falls 30 pc from current levels, Muthoot is well protected.

9. Another way of playing it is that Muthoot NCD gives you a total of 27 pc absolute return in next 2 years. Instead of Muthoot, buy a gilt fund which should give you a return of 20 pc in next 1 year and then lock in that amount at say 8-9 pc which should be the FD rate in 1 year time frame. Same returns but much more safer.

Next week will be a quiet week with 4650 and 4820 the range. Play safe. Those interested in individual stock picks we have Lakshmi's Cherry Picks.

Sunday, December 18, 2011

Markets Ahead

The Rate Hikes took a pause and the markets tanked in the last 2 hours to close the week -4.4 pc. Lets take a look at what lies ahead for the Indian markets.

1. The RBI as expected took a pause. There were wide spread rumors of a CRR cut. There is no basis for a CRR cut and these were just rumors spread by vested interests to take the markets down. The Gilt funds have a given an absolute return of about 4 pc in 1 month and this is an early indication of the benefits of gilt funds now that the Rate Hike cycle is coming to an end.

2. If we take a look at the Elliot waves. and C5 commencing from 5400.
C-5 -1 = 5400 - 4640 = 760 points
C-5-2 = 4640 - 5099 = 459 points which was almost equal to the golden ratio of 61.8 pc retracement.
If the second wave ended at 5099 then the targets for wave 3 are 4339, 4132 and 3869. The bare minimum target is 4339.

3. The key support areas of the retracement of the entire up move from 2250 - 6339 are 4777, 4295 and 3812. We have already seen how the area around 4777 (+/- 100 points) has given support multiple times. Now may be it is the time to test the support around 4300-4400 area.


4. The area around 4750-4800 now offers a stiff resistance and can be a shorting point.

5. We are testing the support line of the entire up move from Oct'08 and it should hold. There is a cluster of supports around the 4400-4500 area.


6. We are also heading into the holiday season and trading volumes will be thin. I expect expiry to be above the 4700 area.

7. Gold has corrected sharply and is soon heading into buy territory.

8. This is a good time to lock into high yielding fixed income and Gilt funds. The current high rates may not be available for some time to come. It is also the time to start building a portfolio of quality stocks. For those interested, we have Lakshmi's Cherry Picks.

Sunday, December 11, 2011

Action Packed Week Ahead

The Next week brings in a lot of news on the domestic front. This could be the last week of real big moves before everyone gets into the holiday mood. Lets try and take a look at the action ahead.

1. Next week, we have the monthly IIP numbers, monthly inflation figures and to end the week we have the RBI policy. If we have poor IIP numbers and tame inflation figures, the RBI may pause and even in fact cut the CRR or SLR rate. Expect markets to rally if any cuts happen.

2. The European summit has come. The outcome is not as great was expected and I expect markets to react mildly positive on Monday morning and put the event behind it.

3. Technically, if 5400-4640 was wave 1 then we are in wave 2. Now here comes the tricky part.
Wave 2 A = 5100- 4640 = 460 points
Wave 2 B = 5100 - 4841 = 359 points
Wave 2 C = ?
We have corrected around 56 % of the up move. If indeed, C is pending, then we have targets of 5125 and 5300 ahead.

The invalidation point for this would be 4720.

4. December has the year end bonuses coming up and hence usually there are not many huge falls in December. Markets do have a history of peaking out in January. Let us see what happens this year.

5. The PPF limit has been enhanced to 1 lakh. One can put in the extra 30000 rupees and get a higher interest rate of 8.6 % instead of 8 %. Also, Infrastructure bonds of IDFC and L&T are in the market giving an attractive interest rate of 9 % along with tax savings of about Rs 6000.

6. The government has been paralyzed with the FDI in Retail put on hold and the Anna Hazare agitation looming ahead. Ana agitation has the potential to defeat the UPA in the next elections whenever they are held. Manmohan Singh will not last this full term till 2014. The Congress will make a change to have a fighting chance in the next elections whenever they are held. This also caps the upside to the markets.

Its time to wait and watch with 4720 and 5050 as crucial breakout points. 1 could go log with 4841 as a stop loss.

For those interested in individual stock picks, we have Lakshmi's Cherry Picks.

Sunday, December 4, 2011

What does December hold for us?

The markets returned their best weekly showing in 2.5 years to close at 5050, a net gain of about 7.2 pc. Are we out of the woods?Let us try and explore.

1. This stunning rally has been on the back of Domestic liquidity. DIIs have bought about 700 crores worth of shares whereas FIIs have sold to the tune of 110 crores. FIIs have sold for about 3 days of the 6 day rally.

2. The Nifty has outperformed the broader market. The Nifty has gone about 7.2 % for the week whereas the broader CNX 500 has gone up by less than 6 %

3. The month of December has by and large been a very positive month for the equities. Since December 2002, the markets have always closed above the November close. This implies that this year if we go by history the markets should close above 4832. In all the years, the low for the month has always been below the previous month close. This implies that we should go down below 4832 at least once during the month.


4. If I try and project the average values, close should be around 5131, high at 5187 and low around 4731.

5. If we consider this up move as a retracement of the 5400-4639 fall then the next resistance to the up move comes at 5110.

6. In terms of number of sessions, the up move if it is an retracement should last for 6 to 10 sessions. 6 sessions are already over.

7. The logjam over FDI in retail will impact the markets negatively over the weekend. The next week should be either a flat or down kind of week.

For those interested in individual stocks or Gold, we have Lakshmi's Cherry Picks which are doing well.

Sunday, November 27, 2011

Corrective Bounce Due

The Markets fell about 4 pc to close at 4710 for the week. This was on the back of a 5 pc fall last week. The Markets are deeply oversold in the short term and are due for a bounce.

1. The markets have been falling hitting 5400. This is the 5th wave of the C wave which started from 5944
C1 ended at 5196
C2 ended at 5740
C3 ended at 4720
C4 ended at 5400

C5-1 ended at 4640 or should end soon. If C5-1 ended at 4640, C5-2 can go uptil 4930, 5020 or 5109.

2. Historically, the area from 4539 to 4700 has a cluster of supports and will not breakdown so very easily. A bounce of 400-500 points is very much on the cards.

3. The downward sloping channel shows supports at 4430 and resistance at 5320.


4. The difference between 5 day moving averages and the 20 day moving average has moved near historic support levels. This implies a bounce is due.


5. Historically, the month of December has always been a positive month with gains above 5 pc. Hence, the next week may be the last week of the fall at least in the short term.

To summarize, buy at supports 4640 and play for a bounce in the month of December. It is also time to start building a portfolio of blue chips and for those interested, we have Lakshmi's Cherry Picks.

Sunday, November 20, 2011

Chickens come Home to Roost

The markets were down about 5 % to close the week at 4906. All the gloom and doom predictions are slowly coming true. In all this bad news lies the seeds of the next bull run. Lets see what the future holds for the Indian economy.


1. Kingfisher huge debts are threatening to derail the airline industry. Kingfisher going bust or requiring a bailout as serious implications not only for the airline sector but the banking Sector. The government is talking about FDI in Aviation. This comes a bit too late. Who will invest in India's ailing airline sector and even if they do it will be at throwaway valuations.

2. The Banks are threatened by NPAs. Not only Kingfisher debts but also from the Power Sector. The biggest one to take the hit is State Bank of India. The defaults have just started and things will get much worse before they improve.

3. The Government auctions of 10 year bonds are devolving on the primary dealers. In layman terminology this means that no one is willing to buy bonds from the government at the Interest Rates being offered. The last bond auction devolved at 8.83 %. The Repo Rate is at 8.5%. This pretty much makes the case for holding rates redundant. If the most secure asset in India gives you an yield of close to 9 %, the banks will demand much more from the home loans.

4. Over the last few weeks, ICICI Bank has stepped up bombarding people's mailboxes with offers of flats at sale at much discounted rates. This is another sign that the NPAs of banks in terms of real estate sector loans are beginning to show up. As the layoffs increase and the distressed sales increase, expect the Balance Sheets of Banks to look much more horrible.

5.The mid caps are being slaughtered in the markets. The ones which have large FCCB holdings and the companies where promoters have pledged shares are the ones being hammered. The Mid-Caps are already at a level of Sensex being 10000. Pipavav Defence is an example of being circuit down at Rs 55.

6. Technically, the markets may have made their low 4838 for this settlement. Every rise can be sold into. The supports come at the 4800-4850 band after which comes 4720 and then 4500. The markets are oversold now on a delay basis and some amount of bounce can come to take the market to 5000-5050 levels.

7. Europe continues to struggle with the debt crisis. A discussion with one of my colleagues from Germany underlined the same. The issue is ow how much should Germany support the rest of Europe. The future of Euro is in question and now it becomes a question of national politics rather than just being pure economics. The next year brings elections in France and the US. Germany goes to the polls in 2013.

8. Channel support comes at around 4830.First resistance now will come at 4950. These are small trading ranges and are suitable only for traders. The direction is now very clear and it is on the way down. Not all stocks bottom at the same time and this is a rare opportunity to build a new portfolio from a clean slate.

Amidst this boom and gloom now is the time to start picking stocks which will survive the downturn and will do well with a 3-5 year perspective.We must look for companies which have less amount of debt on the books, have a market for their products and ones which will represent the new India. For those interested in stock picks we have Lakshmi's Investment Cherry Picks.

Friday, November 18, 2011

Investment Strategies in Current Environment

The business channels and pink papers have been obsessive about high inflation in the Indian economy and the consequent rise in interest rates – and well they should be. The government doesn’t seem too perturbed about the deleterious effect that high inflation causes – not just to GDP growth, but also to the wallets of common citizens.

During such times, savings and investments may be farthest from people’s minds as they struggle to make both ends meet. However, there are some comparatively less risky investment opportunities that smart investors can avail of.

Continue Reading my guest post in Subhankar's blog:
http://investmentsfordummieslikeme.blogspot.com/2011/11/business-channels-and-pink-papers-have.html

Sunday, November 13, 2011

Gloom and Doom Ahead

If one goes by the headlines, there is doom and gloom ahead. Airlines are going bust, people are being laid off, bond yields have crossed 9 pc and Italy tethers on the brink of a collapse. Lets us look at things in detail and try and find a silver lining to the cloud.

1. For any medium term upside, 5390 - 5400 remains the key resistance. There are a confluence of resistances here. The previous high comes at 5399, the 200 DMA comes at 5390 as also the lines joining previous tops from 6339 comes at this value. Prudence suggests that one should not go long before 5400 is breached.

2. On the downside, fresh shorts could be taken below 5072 and 5011, the previous significant bottom. We are in some kind of consolidation move right now. This expiry is 9 trading sessions away and we wait and watch. In this series it is only the Option writers who have made money.

3. Fundamentally, Kingfisher is in trouble. The problem is not as simple as an airline going bust. It has a cascading effect. Several banks have a very high exposure to the airlines and their NPAs will go up. The Power sector also has NPAs rising and banks will be wary of lending to the power sector as well.

4. The government bonds are trading at an yield of almost 9 pc. The Repo Rate is at 8.5 pc and will raise further in the month of December. The high yields imply that government bond supply is not being absorbed by the market. In simple language, government is borrowing big time from the markets.

5. Gold is also trading in a range. The previous top needs to be taken out for investments to be made in gold. The rupee has breached the psychological Rs 50 mark. Weak rupee means the companies which import are in trouble. India is an economy which is a net importer and hence the fiscal deficit target of 4.6 % is not likely to be met.

6. With elections in the key states of UP and Punjab round the corner expect no fiscally prudent measures from the government at least till March 2012.

Now, is the time to start nibbling at stocks, systematically picking the good companies. Those interested in stocks and gold investment advice, there is Lakshmi's Cherry Picks available.

Finally, a tailpiece on Austerity in these tough times by Sanil Sonalkar.
Financial year 2011-12 has truly marked the dawn of a new era of austerity measures being adopted by countries worldwide, caught in the midst of a recession which seems to be spreading by the day. The developed world, particularly the USA & the Eurozone countries, are grappling with huge debts and failure to pay sovereign obligations is becoming a stark reality. To tide over the crisis, these countries are resorting to unprecedented austerity measures in a ferocious bid to salvage pride and credit ratings (no pun intended).

Back home, the common man is increasingly feeling the burden of high prices and household budgets have taken a hit like never before - austerity begins at home too. The government,
almost belatedly, has tried to offer some respite by increasing the interest rate on the popular savings schemes - PPF, NSC, etc, etc. This may seem too little, too late.
A judicious mix of savings and investments is the order of the day in these troubled times.

Sunday, November 6, 2011

A Party at Crossroads

There comes a time in every individual's or a nation's life where they stand at crossroads. Similarly, the Congress party has come to a point where they are at a crossroad. The next 24 months will decide where the party goes, and consequently where India goes. Our stock markets will be a reflection of where India is headed to.

In 1998, Sonia Gandhi took over as the Congress President. The Congress Party was in shambles. The BJP was riding a wave of Vajpayee induced euphoria, the Congress tally was plunging and no one gave the party a chance. Under Sonia, the party was losing election after election and no one gave the Congress much of a chance. Elections in May 2004 shook the nation and also shook the stock markets when Congress with the Left Front support came to power.
Sonia's masterstroke was yet to come. She stepped out of the race for the Prime Minister when the seat of power was hers to take. In one swift move she took the wind out of the sails of all those baying for her foreign origins. Manmohan Singh, an apolitical person, world renowned economist and more importantly a person with no political power took over as PM.

UPA - 1 was all about reforms. The Right to Information bill, the NREGA and the Nuclear bill being passed. In May 2009, the Congress came back to power minus the baggage of the Left Front. With great expectations come great responsibilities. It has been downhill after that with scams breaking out, inflation pinching the pockets of the Aam Aadmi and Congress being bruised in the by-elections.

Now, the news is Rahul Gandhi will become the Congress President, the 6th member of the Nehru Gandhi family to take over the reins of India's most influential party.

We have the elections in Uttar Pradesh in early 2012. The Congress has tied up an alliance with Ajit Singh who is powerful in Western UP. The Congress may emerge as the kingmaker as there seems to be no clear winner in UP. The Samajwadi Party, BSP, BJP and the Congress seem more or less equally placed with Mayawati edging ahead at the moment.

The real test of Rahul Gandhi will come in 2014. The Congress at the present moment is badly placed and is vulnerable to a defeat.

It is a real possibility that Manmohan Singh would be replaced in early 2012 after the elections in Punjab and Uttar Pradesh are out of the way. The most likely candidates to replace him are Pranab Mukherjee and P Chidambaram. The joker in the pack is someone like Kamal Nath.

It makes very real sense to replace Manmohan Singh. The scams and inflation have taken a toll on his image. It will be almost 7.5 years of him being in power. Time to have some old wine in new bottle.

The 3 leaders mentioned above have the same characteristics of Manmohan Singh. None of them are mass based leader and can never pose a threat to the Gandhi family.

Rahul Gandhi taking over as Prime Minister is the Ace in the Congress Pack ad I do not think, they will deploy that so early in the game.

What happens if Congress does not win in 2014?


There can be 2 alternatives. A NDA coalition coming to be power led by someone like Nitesh Kumar who has the credibility for good governance or a hotch potch Third Front government riding on the crutches of the Congress Party. This would lead to a repeat of the uncertainty of 1996-1998 period where the markets went no where basically.

Sonia Gandhi has left her footprints on the sands of Indian Political history. Let us wait and watch what Rahul Gandhi does.

Now, we come to our markets. Keeping all this in mind, I do not see the markets running away anywhere in a hurry. The crystal ball will become clear only sometime in mid 2012- 2014 period.

Now is the time to pick up blue chip stocks at good valuations. Invest in companies which will do well, keep 2015 as the target in mind.
For those interested in a selection of good stocks, Lakshmi has a pretty good collection very reasonably priced. One may contact her for her Investment Cherry Picks.

Sunday, October 30, 2011

Markets: Have they given a breakout?

It was a news filled truncated Diwali week. Diwali is over and now is the time to look ahead. Lets try and see what possible road the market takes ahead.

1. The RBI policy as expected hiked rates by 25 basis points. The fine print was that Savings Bank Interest Rates have been de-regulated. This has potential to erode the profit margins especially of large private banks. Yes Bank immediately offered 6 pc Interest rates on Savings Account. This is a drag on the private sector banks.

2. Europe crisis has been averted by the Private Banks taking a 50 pc haircut on their loans. If it was Greece alone, then crisis would have been averted. What happens when Italy and Spain default. Politically it is a master stroke by China. They have agreed to give funds but the first losses would be borne by the European governments. China's role as a World power has gone up several notches. This development heralds the shift of political power towards Asia. Earlier, China was an economic power, now political influence follows.

3. Our markets have filled the gap at 5350 - 5215 and this was broken by a gap up. This is also known as Island reversal provided there is follow up buying. We now run into a wall of resistances around 5400 - 5500 with 5470 being a key resistance on multiple parameters.

4. The crisis has not been solved, its only delayed. 5450-5500 also represents the trend line joining the tops from 6339. This should be taken out on a weekly basis, to herald a fresh bull market.

To Summarize, we are in a powerful bear market rally. Only a close above 5500 on a sustainable basis would foretell a fresh bull market. We are just 150 points away from a breakout. We wait and we watch on the sidelines.

For those interested in Stocks Picks and Gold, Lakshmi has her Investment Cherry Picks and Gold Rush on offer.

Wednesday, October 26, 2011

Diwali Musings

Today on the day of a new Mahurat it is time to take stock. In the last 1 year, the markets have gone down about 16 pc. What does the road ahead hold for us?

1. Now is the time to start building your portfolio gradually. Think with a horizon of 5-10 years and look for companies which will power the new economy, the new world order.

2. Once identified, start adding in installments. Every 200 points lower on Nifty say add 10 pc.

3. Look at locking in NCDs and fixed income instruments at the current high rates of interest.

4. Buy Gold strictly in dips or on breakout above previous highs.

Its important to come up with a financial plan and follow it to closure.

I came across this site Money Works 4 me
This site has several interesting things which i find are different from the other sites. It is an independent site only dedicated to stock research and has an interesting product Company X- Ray. Please do check it out.

For those interested in Stock Picks and Gold, do check out Lakshmi's offer. She may offer financial planning services on a selective basis too. Those interested can get in touch with her.

Sunday, October 23, 2011

Markets: The Week Ahead

It is a crucial week for the markets with the expiry on Tuesday and a curtailed trading week. TO complicate matters we have the RBI policy to boot on Tuesday. Let us see what the markets have to offer.

1. Expiry on Tuesday and RBI Credit policy on same day is potentially explosive cocktail. RBI should hike rates by 25 basis points. Anything less or more could trigger about 100 point moves on the Nifty.

2. The resistance of 5170 has held for 3 attempts now. Either we break it in the move or we tank to to test 4720. Above 5230, we can re-test the 5350-5400 zone.

3. If money is pumped in for Euro crisis and Greek gets a bailout, expect dollar index to go up, commodities to crash and gold to weaken in the short term.

4. One can look at investing in the Infrastructure Bonds of PFC covered in an earlier post.

5. The results are coming in and nothing spectacular to write home so far. The good results will be out and the ones declared later are usually nothing to write home about.

6. Infrastructure companies are bearing the brunt of the slowdown, like HCC and L&T.

I expect the markets to trade in a range in this truncated week. Have a safe, happy and prosperous Diwali.

Those interested in a package of Gold and Equity Picks investments can look at what Lakshmi has to offer.
Gold Rush and Investment Cherry Picks

Thursday, October 20, 2011

Should one invest in Infrastructure Bonds

The season for tax saving is still some time away but it always pays to start soon. Infrastructure bonds is a new tax savings category introduced last year. Lets have a look at it. I had written a guest post for Subhankar's blog. It is accessible at:
Power Finance Infrastructure Bonds Review

Sunday, October 16, 2011

Markets: The Week Ahead

It was a rally on D-Street and the Nifty rallied about 5 pc to close the week at 5132. What will the coming week bring ahead. Will the rally continue or will it sputter. Let us try and find out.

1. The October Settlement is a truncated one. The expiry is happening on Tuesday, Oct 25th thanks to Diwali. This gives us about 7 sessions to expiry.

2. The RBI credit policy falls on Oct 25th. So, we will have action packed expiry this time. It will be like a lottery as a 100 point swings can happen.

3. The inflation is still not under control. I expect a 25 basis points hike the this policy meet.Interesting thing is that bond yields have moved significantly higher in the 8.7 - 8.8 pc band. This also implies that government borrowing is taking bond yields higher. Macros suggest a high interest regime to continue.

4. There are a slew of corporate results coming in this week. Usually the early results are the good ones. Reliance just about met expectations thanks to high refining margins,Infosys benefited from a weak rupee. The poorer results should come from the Banks (Treasury losses), Autos (poor sales) and Infrastructure companies.

5. The Nifty is moving towards the critical resistance of 5169 again. It has failed to move in past 2 attempts. After this we have the gaps from 5229 - 5331 to be closed. We are headed towards a cluster of resistances and it should be interesting to watch how the Nifty behaves at slightly higher levels.

6. This could be the 4th wave of C-3. refer earlier posts for exact wave counts. This wave can typically go up to 5350-5400 and then we have the last wave down which can last for 4 months.

7. The layoffs have started in financial institutions. The Petrol prices may be hiked again if the crude prices go up coupled with a weak rupee.

Do look at investing Infrastructure Bonds for tax savings. More in my guest post in Subhankar blog.

Tough times ahead and time to brace up.

Lakshmi has come up with a presentation on Gold to go with Equity Picks. I have helped her prepare both.
I am enclosing the link to her offer. I feel its a very attractive offer.
The Gold Rush starring Lakshmi Ramachandran

Thursday, October 6, 2011

Double Top

We hit the tops at 6357 in January 2008 and 6339 in November 2010. The support levels cam at around 5100 which have decisively broken giving a target of 3700 to 3900 range.
Time elapsed between 2 peaks is 32 months, so it may be another 32 months from November 2010, which comes to June 2013 that we cross 6350 again. It could also mean the Bear Market could last 32 months out of which 11 months have elapsed. This is same scenario as 1992-2000 where the market was stuck in a range.


For those interested in stock picking in the downturn, I am enclosing the link of Lakshmi.

She has come up with the updates for the month of October 2011. I have helped in identifying the stocks on the basis of fundamentals.

Investment Cherry Picks for the downturn

Sunday, October 2, 2011

Where does one hide now?

The last quarter has been bad for the equity markets. The Government borrowing is going through the roof and Gold prices are declining. What does an Investor do next? Lets try and work out the best investment avenues.

1. The Goverment has ended borrowing about 66 pc of their full year target in the first 6 months. This means in H2, they will borrow more. This means Rates will go up and Bonds yields have risen. Gilt funds will still have to wait for sometime or one can do a SIP in Gilt funds. Interest Rates are yet to peak out.

2. The US Dollar is strengthening due to safe haven status. This means all other currencies will weaken against the Dollar. The rupee may go down further and all commodities including Gold can correct 10 pc more. So, buying Gold doesnt make too much sense right now.

3. The Equity markets have been going down. There is fear and panic everywhere. Support levels are 4538, 4300, 4000 and 3700. One can start adding near each support level about 20 pc quantity.

4. Other Option is to invest in liquid funds or stay in cash. The inflation will eat away the value of Cash and liquid funds may give up 7-8 pc.

5. In the long term, if India has to do well, then the Equity markets have to do well. As Warren Buffet says, when markets fall the environment is so bad that no one ends up buying anything. Now is the time to build the future and start investing for the next 5 year horizon. SIP in Stocks which are of good quality.

The Nifty has support around 4900, 4840, 4720 and then 4538. upside resistance is the band of 5030 and a cluster of resistances around 5100 and 5200. Fresh shorts below 4840 and longs above 5169.

For those interested in stock picking in the downturn, I am enclosing the link of Lakshmi.

She has come up with the updates for the month of October 2011. I have helped in identifying the stocks on the basis of fundamentals.

Investment Cherry Picks

Sunday, September 25, 2011

Inflation v/s Growth

There is a national debate going on over the rising Interest rates and the rate hikes by the RBI. Should growth be sacrificed at the altar of curbing inflation. It is a interesting debate and merits a deeper look into it.

The RBI has deviated from the global central banks by raising Interest rates and we now have the Repo rate at 8.25 %. This is the rate at which the RBI lends to the banks. A higher Repo Rate means Interest Rates rise and it becomes difficult for businesses to borrow money and invest in expanding their businesses.
Global, the interest rates are pegged near zero the US Fed and the European central Bank.
What are the advantages of low interest rates?
This means businesses can borrow cheaply, spend on expansion, use that money to buy commodities, speculation, pump up the markets and in general have a good time.
Now if it was so good to have low Interest Rates then why is the RBI increasing rates and spoiling the party?
Unfortunately growth always comes at a price. When we have money chasing too few things and money is available freely, the resources become more expensive.
Inflation drives up the prices and if the wages do not keep pace the life of common man becomes difficult.
Cheaper money also means the value of money goes down. 100 rupees could buy many more things in the 1990s. It could buy 5 litres of petrol, now only about 1.5 litres of petrol for the same price.
Inflation happens because of 2 things. Inflation is a by product of supply demand. Whenever there is a mis-match that when demand exceeds supply, then prices go up.If demand is more, it can be reduced by raising the cost of money. If there are supply side constraints, then production has to be increased.
Unfortunately, the RBI can only look at demand management.India's economy is growing at 7.7 pc which is much more than the world economy growth rate of 3.1 pc and developed economies growing at almost 1-2 pc. The RBI can afford to raise Interest Rates by sacrificing some more growth.
The life of the common man is made tough by inflation. This leads to labor unrest and in general strife. The price of many of the daily essentials going out of reach of the common man
The RBI is criticized by the financial commentators because they have a vested interest in having low interest rates. They can sell more things, can speculate more.
In 2008, Governor Reddy was criticized for raising rates too early but in hindsight, India suffered only a slowdown not a recession. Many did not even feel we were in a slowdown as the job cuts were relatively less.
We are on the cusp or rather already in part 2 of the recession. The next 1 year is going to be bad very bad. Its time to preserve capital and build for a better future in the growth that follows.
Governor Subbarao for all the criticism he is facing now may well turn out to be a visionary. His steps over the last few months have been bold and much needed.
The Recession never ended. It was only a pause due to artificial pumping up of the economy in the US. The second part is still pending and almost here. Last time it was Financial Institutions going down, this time it will the sovereign defaults.

For those interested in stock picking in the downturn, I am enclosing the link of Lakshmi,

I am enclosing the link of Lakshmi for those who are interested in bottom fishing of stocks.

http://vipreetinvestments.blogspot.com/2011/09/wanna-shop-with-me_10.html

Editor's Note: Aarti's comments say everything.Thanks Aarti.
Questions to be asked are::::

1. Is liqidity in system drained out to such extent thta banks not able to fulfill needs of corporate credit? Answer is No.

2. Is money growth in system curtailed? Answer is No.

3. Are govrnment 364 day T Bill yields crossing even 8.5% even when repo rate is raised to 8.25%? Answer is No. This is more than enough indiccator of abundance of liqidity in system.

4. What is interest cost of corpratesout of their EBIDTA revenue & how much thta is incrementally increasing with each 1% rise in repo rate? A few basis point if not more. Plz dunt tell coporates are so poor not able to absorb those few basis point rise in costs. That too atfer they are increasing product price beyond 9% YoY (this is nothing but WPI growth aka inflation).

5. What is that social commitment coporates are showing to give back to poor, reducing their product prices voluntarily or to improve literacy levels or to improve civic amenities? Absolute nothing.

Coporate world is running after free money & speculate & mindlessly expand & live beyond it means & show excess in balance sheet as their hard earned profit.

That runaway balance sheet growth on free money is being dubbed as GROWTH on retail investors. Retail investors are being taken for granted, they are getting commanded by industry shenanigans to believe all cock-bull stories only because big shots are telling it on TV.

This is getting as hilarious as it can get. All of us can get it using a bit of some brain, not by singing a chorus for white collar thieves' song.

This nonsense of crying over 0.25% intrest rate increase hurting growth must be stopped.

Saturday, September 17, 2011

At crossroads: Tricky Juncture

It was a week where market threatened to tank and then showed signs of breaking out but ended up with 0.5 pc gain. Markets are at cross roads with endless possibilities before breaking down.


1. As per Elliot, this could be sub-wave 3 of C starting from 5741 and we are in the last leg of upmove of sub waved 4.
Sub waves of 3 as below:
1. 5744 - 5497
2. 5497 - 5702
3. 5702 - 4720
4. 4720 - ongoing
4 A till 5169, B till 4911 and C ongoing. If this is 4th wave of 3rd then should not go beyond 5200.

It could also be Wave 3 ended at 4720 and this is C-4 which can go on till 5360.
In any case, the upmove should end this week.
Wave 1 5944 - 5196
wave 2 5196 - 5741
wave 3 5741 - 4720
wave 4 4720 and ongoing

(This is preferred view)

To summarize, if C-3-4, upmove should end soon. If C-4, then the market can go up to 5300-5400.

3. The RBI has hiked interest rates 25 basis points. This will leave less cash in hands of people as also kill demand. Inflation is also raging. The Petrol price hike of 3 bucks adds to the misery. Growth is slowing down. Stock Markets moving up looks to be difficult in all this.

4. Banks and autos will be the most affected along with real estate stocks. These sectors should be on the avoid list for the time being.

5. The problems of Europe are still not solved. All these are temporary fixes. Time is being bought.

6. Money should be locked in gilt funds. The NCDs have come and gone. Buying should be done around 4600-4800 band.

7. The rupee has depreciated to 48. After the rate hike, some pullback to 47.20 is seen. A weak rupee further diminishes the returns of FIIs.

To summarize, fresh downsides when 4900 breaks, 5020-5040 is another support area. On upside 5130 -5180-5200 are strong resistances beyond which comes 5350-5400.

For those interested in stock picking in the downturn, I am enclosing the link of Lakshmi,

I am enclosing the link of Lakshmi for those who are interested in bottom fishing of stocks.
http://vipreetinvestments.blogspot.com/2011/09/wanna-shop-with-me_10.html

Thursday, September 15, 2011

Beginner's guide to Investing in Stocks

This is a question I come across very often. I am new to the stocks markets how do I begin investing? I had done a guest post for Subhankar's blog.
The link is as below:
http://investmentsfordummieslikeme.blogspot.com/2011/09/beginners-guide-to-stock-investing.html

Sunday, September 11, 2011

Decisive Week Ahead

The Markets gave up almost all their gains on Friday and closed up only 0.4 pc for the week. The next week is crucial because the RBI policy is on Friday which will give further directions to the market.

1. If we take the rally from 4720 to 5169, retracement levels come to 4997. 4944 and 4891. Only a close below 4891 will indicate fresh new lows.

2. There could be 2 possibilities of this corrective up move. 1 is that the entire up move is done and we are on a fresh leg down. The other is A-B-C up move and only the A leg is done. B downwards till 4891 max and a final rally up to 5232 or 5350.

3. The rupee has weakened to 46.57 which is way above its high of 44. What this means is that the FIIs are losing money. To take out dollars, they have to convert rupees into dollars. They need to convert more rupees to get same amount of dollars they put in.


4. Crude Oil imports cost goes up and also price of Gold increases in INR terms.

5. The NCDs have mopped up almost a billion dollars of worth and there are no further prospectus lined up. Later during the year, we have NTPC ad NHPC coming up with NCDs with 10 year maturity.

6. Gold has held up very well. It has bounced up after every fall. In rupee terms we are almost trading at all time highs. Gold continues to be buy on dips.

7. The Obama Job plan has nothing concrete in it. In US, thanks partly due to technology jobs continue to be lost and they are not going to come back. For the Eurozone worries also, nothing concrete is in place and that is why the markets keep falling after bounces.

8. Elliot gives 2 possibilities. Of C wave down from 5944, the current rally is the 4th wave of the 3rd down. This means after a fall to 4500-4700 we have a rally till 5300-5400 and then a final fall to maybe 4000 on the Nifty.
It could also be that the current up move is the 4th wave of C and then we shall have 5th wave till about 4300 - 4500.

Whatever the possibilities, upside seems limited and downsides still appear to be about 20-30 pc.

9. The Earnings of the Nifty have gone up by 31 pc in the 3 years since we hit the bottom in 2008. Equivalent bottom of 2008 comes to 2952 on the Nifty or 9832 on the Sensex. If we consider the closing low, it comes to 3276 on the Nifty.
Hence 3300 to about 30 pc above 4300 represents a buying band.
The range between 3300-4300 on the Nifty represents absolute value. In P/E terms this comes 12-15.5.
Strategy could be deploy 20 pc funds at 4300 and 20 pc at every 200 points below it. Which means 4100, 3900, 3700 and 3500. This is just a rough guideline. If the markets rebound, then one could also buy a bit higher.

For those interested in stock picking in the downturn, I am enclosing the link of Lakshmi,

I am enclosing the link of Lakshmi for those who are interested in bottom fishing of stocks.
http://vipreetinvestments.blogspot.com/2011/09/wanna-shop-with-me_10.html

Sunday, September 4, 2011

Technicals for the Week

The markets closed up 6.2 pc for the week to end at 5040. Let us look at what is in store for the coming week.

1. We have a short term low in place as the market cleared the previous high of 4965 quite comfortably and closed above it for the past 2 days.

2. This means the down move from 5944 is in its 4th wave up. Retracement targets could be 5110 (already done), 5230 and 5350.

3. 4th Wave is in three legs A-B-C. A may be done at 5114. B could end at 4964, 4917 or 4870. Only a close below 4870 indicates weakness.

4. Gold continues to rise and we should see a rise till about 2200-2400 USD. Gold is buy on dips till it hits the targets

5. The Gilt funds have started giving a monthly return of about 1 pc for the past 2 months. Time to add more funds in the Gilt funds after the RBI Meet on September 16th. Hike of 25 basis points is factored in, but I would ot be surprised to see a 50 basis points hike looking at inflation and the GDP numbers.

6. Trend line support comes at 4955-4965 again underlining the significance of this level.

7. On the upside we run into resistances in 5180 - 5200 band. Immediate resistances come in at 5100-5120.

8. The Bollinger Bands give resistances at 5195 and 5350.

To sum it up, watch out for supports at 4965, 4920 and 4870 and resistances above 5100.

I am enclosing the link of Lakshmi for those who are interested in bottom fishing of stocks.
http://vipreetinvestments.blogspot.com/2011/09/wanna-shop-with-me_03.html

Thursday, September 1, 2011

Stock Picking in the Downturn

I keep getting queries which are the stocks to buy in this season of downturn. My friend Lakshmi whose Technical Analysis I love has come up with a shopping list. Have a look at her blog at below link:
http://vipreetinvestments.blogspot.com/2011/09/wanna-shop-with-me_02.html

Wednesday, August 31, 2011

The Importance of 5265

The last rally was 545 points from 5196 to 5741. This comes to 545 points. From 4720, equality will be achieved at 5265.

Anything above this has bullish implications.

Sunday, August 28, 2011

Technicals for the Week

The markets lost another 2 pc during the week to close at 4748. The picture is looking gloomy all round. What does the market bring for us the next week?

1. Anna Hazare fast is over and Ben Bernanke Jackson Hole meeting did not bring any nasty surprises. Expect some bounce next week.

2. The Elliot wave analysis states that we are in last down move of the 3rd wave down.
C wave so far.

Wave 1 - 5944 - 5196 = 748 points
Wave 2 - 5196 - 5741 = 545 points
Wave 3 - 5741 - 4796 = 945 points and ongoing
Wave 3 can be sub - divided into 5 waves
Wave 1 from 5744 - 5454 = 190 points
Wave 2 = 5454 - 5552 = 98 points
Wave 3 = 5552 - 4946 = 606 points
Wave 4 = 4946 - 5198 = 252 points
Wave 5 5198 - 4720 = 478 points and going on

Wave 3 has traversed a distance of 1024 points.If it extends to 138.2 pc of wave 1, target would be 4707.
If it extends to 161.8 pc then the target would be 4530 which is also near to the November 2009 bottom of 4538.

3. A bounce from these levels would last for 3-4 weeks and can go up to 5110, 5230 and 5350. Only a close above 5550 would signal a fresh bull run.

4. All bounces should be used to go short, Longs only above 4900 for short term trading.

5. The Weekly RSI is at a critical support area over the last 20 years. So, a bounce is due.

6. Trend line shows above 4867, the downward trend of this fall gets broken.


7. The 5 week low ema comes at 4959, a close above this shows end to the down move.

8. RBI may hike rates just 1 last time on September 16th. The next week is a truncated one and expect muted trading.

9. The Channel resistances come at 4881, 5038 and 5296.


Now, is the time to start preparing a shopping list and beginning to buy.

Sunday, August 21, 2011

Markets Next Week: A bounce due

The Markets continued their downward journey last week. They fell by around by 4.5 % to close at 4845. Gold hit new all-time highs. So what next?

1. Gold has broken all previous all-time highs and is now trading at 1850 dollars and ounce or close to 28000 rupees levels. I would wait for a dip before making a fresh entry. I foresee a short term top close by. Make o mistake, in the next 1 year gold will go much higher but in the short term we may see a buying climax.

2. The Nifty is in the 3rd wave down which will culminate some time next week.

C wave so far.

Wave 1 - 5944 - 5196 = 748 points
Wave 2 - 5196 - 5741 = 545 points
Wave 3 - 5741 - 4796 = 945 points and ongoing
Wave 3 can be sub - divided into 5 waves
Wave 1 from 5744 - 5454 = 190 points
Wave 2 = 5454 - 5552 = 98 points
Wave 3 = 5552 - 4946 = 606 points
Wave 4 = 4946 - 5198 = 252 points
Wave 5 5198 - 4796 = 402 points and going on

After this, we will have the entire retrace of fall from 5740 - 4796 which can be a 500 - 600 point rally on the Nifty.

3. The Retracement levels of entire rise from 2252 to 6338 come to 4777, 4295 and 3812 levels.

4. 4690 - 4740 were the previous highs in the rally which started up. So, this area can prove to be a support zone.

5. All the indicators are now touching levels last seen in Jan 2009. So, either we bounce in a day or two or go much deeper.


6. The 200 week moving averages were last broken sometime in Sept 2008. We are now testing those averages. A weekly close below 4930 spells gloom.


7. On the upside, 2 gaps need to be closed. 4946 - 4846 and 5323 - 5204.

In a nutshell, now is the time to prepare shopping lists and nibble at stocks. The Diwali shopping list which we prepared last Diwali can be a good starting point for stocks.

Friday, August 19, 2011

Support Levels at 4800-4850

I expect 4800 - 4850 to hold and a bounce from there. Time to buy Selectively and only the blue chips.
4800-4850 has a confluence of supports and is an area ripe from which there can be a bounce.

Thursday, August 18, 2011

Investing in Gilt funds

The equity markets are tanking, so where does one invest in?
I had tried to do a bit of study on the funds and the pros and cons of investing in them. Below is a guest post, I had done for Subhankar.
Continue Reading at:

http://investmentsfordummieslikeme.blogspot.com/2011/08/good-time-to-feel-gilty-guest-post.html

Sunday, August 14, 2011

Markets: What next?

The markets lost a further 2.7 pc to close down at 5073. This is on the back of further negative news from Europe and US, a sharp spurt in Gold prices, good IIP numbers and FII selling.

1. The FIIs have sold almost 11000 crores this year ad 7000 crores in the first fortnight of August. The DIIs have picked up almost 20000 crores of shares this year and about 6000 crores in August. The market is down about 17 pc YTD. It is clear that the market dances on FII tunes. If the rupee weakens and the FIIs pull out cash, the market will go down.

2. Gold has given a breakout and is a buy on dips. As the currencies of the world weaken and the debt crisis increases, gold will go up.

3. SBI had a poor set of numbers. The NPAs are increasing and also the Rate Hikes look set to continue. Avoid the autos and the banks.

4. We had good IIP numbers and yet the markets fell. Why was this? This is because good growth means the RBI can hike the rates further to tame inflation and afford to sacrifice some growth.

5. Looking at the Elliot Waves, we are C wave from 5944

Wave 1 was 5944 - 5196 = 748 points
Wave 2 was 5196 - 5741 = 545 points
Wave 3 was 5741 - 4946 = 795 and ongoing.

Wave 3 should end this week and get set for a rally of about 450-500 points on the Nifty.

6. The band 4750 - 4900 has a confluence of supports and should hold for the present moment.

7. The gap area of 5204 to 5323 will act as a strong resistance. This gap getting filled up is the first sign of a bounce.

8. Open Interest points out to support at 5000 levels and resistance at 5200 and 5300 levels.

Strategy for the Week:
Historically for the past few months, the markets bounce towards end of expiry and hence cut shorts around the 5000 levels and be prepared for an expiry around the 5200 - 5300 levels.

Saturday, August 6, 2011

Broad Picture: What the coming months hold for us?

Its been a scenario of doom and gloom all across the world the past week. As the Financial Markets bleed, doomsday predictions are announcing the coming end of the world. Lets see what the future holds for us.

Crystal ball gazing has always been difficult.Some things are apparent now. The US will no longer be the superpower it once was. Its influence is on the wane. It is a gradual process, buy say in about next 20 years it will no longer be as dominant as it once was.

They say every century belongs to a country. Earlier,it was the British who ruled the seven seas on the back of its fleet and industrialization. Before that we had the French and Spanish domination.

Printed paper or currency is losing value. Mindless printing of currency notes has eroded the buying power of the US Dollar. Precious Metals like Gold and Silver are the new safe havens.

Downgrades of US AAA Rating means it would be difficult for US to borrow from the world at the same almost zero interest rates.

Europe is in doldrums of its own. After Greece and Ireland, now Spain and Italy are on the verge of default. The future of Euro is under question.

With the 2 major currencies of the world, the Dollar and Euro having a major question mark against their name, gold emerges as an alternate currency.

Domestically, the car sales are slowing down, the housing sales are down and the economy is slowing down

The tell-tale signs are all there. You have new launches like the Volkswagen Vento being pushed at 6.99 % Interest Rates. We keep getting smses from builders imploring us to buy their flats.

The good part is the sharp drop in oil prices. This means no more fuel hikes in the short term.

Looking at the big picture, the cycles of boom and recession have shortened. India does not get into recessions, since it is a booming economy we experience what is known as a slowdown.

The focus now would be on government policy making to bail us out. If we see good reforms then Indian Markets would do well.

For now, we are firmly in the downtrend. Expect support around Nifty 4800 and Sensex 16000 levels.

That is the time, when we buy good strong companies that have survived precious slow downs and come out stronger. Till then, we wait and bide our time.

Enjoy the Rains and keep buying Gold, Gilt funds and small quantities of good stocks.

Sunday, July 31, 2011

Game Changing Week possibly ahead

The coming week is rife with multiple possibilities. The Deadline for US Debt deal is August 2nd and any delay out there could spell doom for the markets. Lets explore all possible Technical and Fundamental Factors.

1. I had a look at the Elliot Waves and they paint a somewhat bleak picture in the near term.

Assuming the rise from 2252 to 6339 was Wave 1 and Wave 2 started in November 2011.
Wave 2 will be sub divided into A, B and C.
Wave A was 6339 - 5177 = 1162 (November beginning to Feb beginning a period of 3 months)
Wave B was 5177 to 5944 (Feb beginning to April end a period of almost 3 months) and Wave C commenced from end of April.

C -1 was 5944 - 5196
C - 2 was 5196 - 5740
C -3 on going

If this is the case then C-3-2 will end soon and the dreaded C -3-3 will start with a massive gap down.

A Wave was about 1200 points so C can be 1200-1800 points giving targets of 4200 and 4800. This will be the buying opportunity of a life time.

2. India Infoline is coming up with Debentures offering up to 11.9 % interest per annum. A small exposure can be considered.

3. Gold is sustaining at new highs. In case of a sharp dip when debt deal gets announced, it would be a buying opportunity.

4. The 5500 - 5700 Range has been broken giving a target of 5300 as first target. 5400 would be a support area and shorts can be covered here and fresh shorts taken on bounces.

5. Event based trading is always difficult and one should always trade hedged.

Sunday, July 24, 2011

Nifty: Technicals for the Week

The Markets ended up 52 points on the Nifty thanks to a stupendous rally on Friday. The coming week is important because RBI policy announcement on Tuesday, then important Results to come, F&O expiry and then US Debt Crisis Resolution. Lets take a bird's eye view about the Technicals.

1. The Markets are still trapped in a range. I see a break out happening above 5700 or below 5500. Till then its a range bound market with a negative bias not withstanding the Friday rally.

2. We run into a the downward trend line joining the tops from 6339 at 5660. We need at least 3 closes above this to declare a breakout.

3. The 200 DMA comes in at 5718. There is a cluster of resistances from 5650-5720 to clear.
.

4. Let us look at Elliot Waves. Assuming,
Wave 1 was 6339 - 5177
Wave 2 A was 5177-5944
Wave 2 B was 5944- 5195
Wave 2 C can be till 5962
This is the alternate count.

Preferred Count is
Wave 1 6339- 5177,
Wave 2 5177-5944,
Wave 3 5944 - 5195 and ongoing which can be subdivided into
Wave 1 5944- 5195, Wave 2 ongoing. This count could be invalidated above 5944.

5. The Standard indicators are all in Downward momentum and its is an Option Writer's market.


6. Looking at fundamentals, I feel this is the last rate hike. Reason is growth is slowing down, Inflation is showing signs of being tamed.Also, I have been noticing that Banks have been very stingy in hiking Fixed Deposit Rates. This means that they expect Rates to come down within next 6 months. The Reverse Repo rate is already at previous highs. The Repo Rate last time went till 9 % and now is at 7.5 % so, we are approaching the end of Rate Hike cycle.

7. The entry into Gilt funds or NCDs of India Infoline at 11-11.5 % Rate of Interest is a good entry point now.

8. Gold has been very bullish and technically is looking awesome on the charts. Buy the dips and year end I feel we could see 1800-2000 dollars.

9. I am confident the Debt Ceiling will be raised soon and there could be an initial breakout or false breakout soon.

Trade hedged and trade light.Expect volatility the next week, and expect some big bang announcement next weekend.
Supports at 5500, Resistance at 5700

Wednesday, July 20, 2011

Chart of the Day: Bollinger Band Contraction


Bollinger Band contraction means breakout or breakdown coming. Check out the last time when they contracted before breaking down. Watch 5709 and 5521 closely. Break of either implies good movement in either direction.

Sunday, July 17, 2011

Gold has given a breakout Technically

A few weeks back, we had uploaded a presentation on Gold. Lets re-visit the presentation and a few short terms pointers.

Gold has given a solid Technical Breakout by Closing above the previous Intra Day high of 1577 dollars, 3 days of the week and on a weekly basis. The next target should be the psychological 1600 USD mark.

The previous top at 1577 dollars will now work as a support.

How do we play Gold from here?
The Rupee has strengthened against the Dollar to Rs 44.54 on the back of the so-called FII inflows. This means that whenever there is a sell off in the markets Gold will rise in rupee terms.

For Gold to rise, even if it remains at current rates in USD terms, the rupee weakening will do the trick.

If we look fundamentally, for Gold things are looking up even more. The European economies continue to flounder, the US will have to go for QE-3 soon.

One should look at Gold as an Investor and continue adding Gold at every dips or when one has some extra cash to put away. 1-2 gms at a time all add up at the end of the day.

Technically, the markets are in a range. Expect the range of 5500- 5650 to break soon, giving targets of 5400 and 5800 on either sides.

The Results are out and the early ones are not too great. Usually, the better results come out earlier.

So, enjoy the rains.

Wednesday, July 13, 2011

How to Use Covered Calls

Individual stocks in your portfolio may be going nowhere also. Can you generate some profits without selling your stocks and losing out on dividends or bonus issues? Covered Call writing may be just the strategy for you.

Continue Reading at:
http://investmentsfordummieslikeme.blogspot.com/2011/07/how-to-use-covered-calls-guest-post.html

Sunday, July 10, 2011

Technicals for the Week: Key Week Ahead

Last week, I said it was Consolidation time and the markets closed about 0.6 % up for the week. The coming week kicks off the Results season and is a key week for the Markets. We have the Infy and TCS Results, IIP numbers and the inflation numbers.

1. The rally has reached a crossroads now. The markets have retraced by 73 pc the fall from 5944 to 5195. They have kissed the 200 SMA and corrected. Sustaining above 5750-5800 means a new new bull run has started.

2. The Indicators like Stochastic, RSI on a shorter time frame all have given sell signals. This implies at least a correction to the whole up move from 5196 to 5740.


3. If its merely a correction then targets could be 5532, 5468 and 5404.

4. 5605 was a resistance many times and will be a support now. The largest correction has been 95 points so far in this up move. So below 5635 we can expect steeper fall.

How do we play it?

For fresh upside wait for the 200 SMA to be broken. This comes at 5742. This is crucial because previous high of this rally also is at 5740.

On the downside, 5635 followed by previous low at 5610. So, we wait for breach of 5600 for shorts.

Supports will kick in at 5588 and 5543.

Trade light and wait for decisive signals.

Sunday, July 3, 2011

Technicals for the Week: Time for a Breather

The Markets have zoomed from a low of 5196 to a high of about 5705, a jump of 509 points on the Nifty in about 10 sessions. The Technical Indicators are now in the overbought zone and time maybe for a breather for the markets.

1. We could label the down move from 6339 as a A-B-C correction. A was 6339-5177, B was 5177-5944. C could be sub divided into Wave 1 5944-5196, wave 2 is ongoing. Wave 2 could be subdivided into A from 5196-5705 and Wave B may have started. Assuming it is Wave B of 2, targets could 5511, 5451 and 5390.

2. Taking time into consideration,

Wave A = 6339 - 5177 = 1162 points (74 sessions)

Wave B = 5177 - 5944 = 767 points (39 sessions)

Wave C, Wave 1 5944 - 5195 = 749 points (50 sessions)

Wave 2 has lasted about 10 sessions so far.

3. The short terms stochastic have given a sell call.


4. The Bollinger Band has been touched on the upper side which is first indication of a sell signal.


5. The trend line joining the tops of 6339 and 6151 was touched at about 5705 and we are seeing a reaction from those levels.

6. The 50 EMA at 5518, the 200 EMA at 5575 and 20 EMA at 5491 should be supports for this correction.

7. Gold has given a decent dip and this is an excellent buying opportunity to buy UTI Gold ETF at about 2100 levels. It has corrected about 100 rupees from its top.

8. The Global problems are still not over. QE-2 has ended and the Greek Debt rollover has just postponed the inevitable. Use the rally to pare the longs.

Sunday, June 26, 2011

Sriram Transport Non Convertible Debenture

As the Equity markets go in a sideways to a downward kind of move, its time to look at other investment avenues. Sriram Transport is coming up with non-convertible debentures offering upto 11.60 % interest.

What are non convertible debentures?
They are debt instruments offered by the company which offer you an annual interest of 11.60% payable annually. These bonds are traded on the NSE and which means you can sell them if you need the money immediately.

How safe are they?
The company is rated as AA by Rating agencies which means the company is pretty stable. The Debt is secured which means if the company goes bankrupt you will be ahead in the queue of people who get their money. This is better than Fixed Deposits.

What is the downside to investing in these NCDs?
Sriram Transport is a middle of the road company not as well known as Tata Capital or L&T Finance. Those NCDs are trading at a yield of 10 pc.

What should one do?
If one has no exposure to NCDs, then one should first look at L&T Finance NCD which gives an yield of 10 pc. One should restrict themselves to a small quantity of Sriram Transport NCD to get the higher yield. This is a risk worth taking if one allocates say 5 pc of one's Debt portfolio max to this offering.

Point worth noting:
This is on a first come first saved basis offering. The issue opens on Monday and closes on 9th July. If interested, please apply early.

The Details of this issue are available at below link:
http://content.icicidirect.com/mailimages/Shriram%20Transport%20Finance-Table.html

Wednesday, June 22, 2011

Gold Presentation

A few days back, Taran Marwah and myself had prepared a presentation on Gold purely looking at the charts. I am adding the presentation below.
The link is as below:
http://groups.google.com/group/nav-files/t/a6e139b52f7dfc1?hl=en

Sunday, June 19, 2011

Pointers to a slowdown

The Economic Times had a couple of articles over the week which caught my eye. These certainly were pointers to a slowdown last time around. Lets have a look at them.

1. The ET had an article how many Real Estate agents had gone under and had shut shop. These folks had moved to other professions. The Real Estate Market was down in the dumps. Related to Realty 1 more transaction caught my eye.NCPA Apartments arguably the most prized address in Mumbai where people like Ratan Tata and Uday Kotak stay, a flat was sold for Rs 85000 per square feet.I remember very clearly that flats here had gone for as high as Rs 1.05 lakh a square foot a few years back. If a up market flat goes for 20 pc less, then that means other flats should be at least cheaper by 25 pc. The NCPA Apartment has a premium because hardly any flats come up for sale and to have Uday Kotak and Rata Tata as neighbors means one had arrived in life in Mumbai.

2. I have been bombarded by SmSes the last week by Realtor having property for sale.Signs of increasing desperation?

3. The RBI hikes mean for those who bought flats a 3 years back the repayment tenure has gone up from 20 years to close to 40 years. Now, banks calculate the working life of a person when factoring in EMIs. This means they will soon ask borrowers for part pre-payment.

4. Brokerage houses have started laying off people. This again is from the ET. During the last recession also layoff were maximum in the Brokerage Houses. Volumes have dried up in the stock market.

5. This latest Rate Hike is definitely not the last one coming. 10 year yields are already at 8.3 pc whereas 1 year T Bill is also at 8.30 pc which points to a situation of almost inverted yield curve. Typical long term T-Bills should get higher rates.

6. The Housing Market will hold up as long as builders have money to prop up assets for which there are no buyers. They can hold on to the artificially swollen property prices till they can finance their projects.

7. The Technical Indicators point out at the last supports between 5300-5330 after which may head to 4800. There is nothing much for the markets to rise and all rallies can be used a shorting opportunities.

Sunday, June 12, 2011

Technicals for the Week

It was a range bound trading week with a slight negative bias. The trading range is narrowing and a break is imminent. This should give a move of 200-300 points.

1. The coming week has the Inflation Data on June 14th, Advance Tax data on June 15th and the RBI Meet on June 16th where I expect key rates to be hiked by 25 basis points.

2. The short term stochastic which are leading indicators and the MACD have given short term sell signals.


3. The 61.8 % retracement of rally from 5329 to 5605 comes at 5434 which is a key level. This is a good level to book some shorts and re-enter at 5385.

4. The Bollinger Bands hint at a bottom at 5348 as first target.


All in all, nothing much has changed.Levels on the downside are 5434 - 5384- 5328. On the upside are 5514-5550-5576.

Sunday, June 5, 2011

QE 3 Coming: What it means to the Layman

The US Government has been printing dollars and pumping in money to keep its economy afloat. We had Quantitative Easing 1, 2 and 3 may be on its way. What would be the implications for Global Markets?

1. QE-2 ends on June 30th. This means no more pumping of dollars and the Fed Balance Sheet begins to shrink. If there is no QE-3 expect the US market to collapse at least 20 pc and treasury yields to rise. The Dollar would strengthen and Gold and other commodities like Oil would flatten or have a slight dip

2. There is a delay in announcing QE-3. Markets first dip and then there would be a rise on the announcement. I feel this would be the most likely scenario.

3. QE-3 announcement comes through. Asset inflation goes on. US Dollar crashes, Crude jumps. If QE-3 comes through, within a year crude should hit 200 dollars a barrel, Gold 3000 USD an ounce and the US Dollar toilet paper.

How do we play the scenarios?

Right now, wait and do nothing. Technically wait for Gold to close 1570 dollars an ounce and then buy gold or wait for the announcement.
Equities are a no-no for the simple reason too many negatives. Inflation, rupee weakening are just a few negatives now.
If QE-3 comes and Equity markets do rise, I would still prefer Gold as US Dollar is a certainty then and Equities will just have small (maybe a few months) boost. QE-3 would likely set the road map for the next year or so for the world.

Wednesday, June 1, 2011

Chart of the Day

5600 has been key level many times, resistance and support and 200 EMA, expect some correction here.

Sunday, May 29, 2011

Technicals for the Week

Markets seem to have made a short term bottom at 5329.Lets look at what could be key levels in the coming weeks.

1. The Fall if completed from 5944 to 5329 would be one leg of a fresh unfolding down move. Retracement levels are placed at 5564, 5637 and 5709.

2. The 20 ema is at 5502 and 20 MA at 5490. Close above these levels key to close all shorts.


3. The 200 EMA at 5600 levels is first key target.

4. The Fall terminated before touching the lower Bollinger Band. Usually for a fall or rise to be completed it has to touch the upper or lower end though that is not a rule.


5. Fresh shorts on break of 5360.

6. If its a 3rd leg fall from 6339, first leg 6339-5177, second leg up 5177-5944. Third leg down from 5944 with targets of 4722.

7. The fall took around 22 days so if its retracement of the entire fall it could take about 8-12 days of rise.We have already completed 2-3 days, which means next week could be positive.

8.Gold is holding the 1500 levels and the dollar is weakening.

9. The G-Sec Rate for 10 year bond has reached 8.4 pc. Peak achieved was 9.55 % and we may be a quarter away from reaching it.

To sum up, long above 5502 if sustains and shorts below 5350. In between stay light.

Sunday, May 22, 2011

200 Day Moving Average and 200 EMA: Market Behaviour

The 200 DMA is supposed to the dividing line between a Bear and a Bull Market. Let us take a look at how the markets have behaved ever since the Bull Run started in March 2009.
The Markets have traded below the 200 DMA 3 times in May 2010, Feb 2011 and now in May 2011. Prior to this, the markets bounced off the 200 DMA in Feb 2010.


1. Each time, the market goes below 200 DMA it seems to spend more time below it. First time in May 2010, it spent 6 days below it then criss-crossed for a couple of times for a day of 2. The low achieved was 4.2 pc below the 200 DMA.

2. The next time in Feb 2011, we spent about 40 days below the 200 DMA and the low was 8 pc below the 200 DMA.

3. This time round we have already spent 16 days below the 200 DMA and the low has been about 6.15 pc below the 200 DMA.

Now lets look at the 200 EMA.


1. In May 2010, we spent 1 day below the 200 EMA and the low recorded was 2.2 pc below the 200 EMA. In Feb 2011, we spent 46 days below 200 EMA and the low was 8 pc below the 200 EMA. This time in May 2011, we have spent 14 days below the 200 EMA and the low recorded has been about 4 pc below the 200 EMA.

2. Also, in Feb 2011, the index tried breached the 200 EMA failing 2 times and succeeding in the third attempt. We have already made 1 more attempt at 5605 and its likely we could have another go at the 200 EMA at 5615 before falling.

As the time has been going by, the index has been spending more and more time below the 200 DMA and 300 EMA indicating that the rally is weakening. This also, means the upside is capped at 5600 and at the downside we have the range 4800 to 5150 to be tested.

Saturday, May 21, 2011

Outlook for Indian Equities - A letter to Taran Marwah

Dear Mr Taran Marwah,

Good Evening.

I am an avid follower of the capital markets and keep myself abreast of all current developments either through the print media or the electronic media (primarily through NDTV PROFIT & CNBC-TV18). I am also
interested in reading articles on personal finance and investments in varied asset classes.

I have often read your e-mails with great interest whenever you post them online and have found them to be quite relevant and meaningful.

Coming back to equities, I have recently stumbled upon reviews by eminent analysts from HDFC Bank & Morgan Stanley who have predicted that the Sensex would touch 24,000 & 30,000 levels respectively within the next 12-18 months. I frankly fail to understand the rationale behind such optimism. Is this just a figment of their
imagination or are there any fundamentals/technicals to justify such high expectations?

My view is that the next few months would be a testing time for Indian equities and that expectations would have to be severely scaled down, keeping in mind the recent muted earnings of top organisations, continuous rate hikes by the RBI with more
rate hikes expected, inflation inching closer to 2 digits, squeeze on the margins of most companies across sectors, etc. Also, I recently came across a news report that within emerging economies, India was beginning to show signs of losing favour with global investors, who were now exploring better returns,particularly in Brazil, China, Mexico, etc.

Would appreciate if you could put forward your perspective on the outlook for Indian equities for FY 11-12 and what levels do you foreacast for the Sensex & Nifty by March'12.

Regards,
Sanil Sonalkar

Friday, May 20, 2011

Crude Oil Presentation

Taran and I had done a study on the historical movement of crude oil prices and the path they are expected to take.
Please refer the path below to access the presentation.
https://groups.google.com/group/nav-files/browse_thread/thread/ddb3a7230421772e?hl=en-GB

Thursday, May 19, 2011

Options for Hedging

Options are much misunderstood and much maligned. They are best used for hedging, and not as a gambling mechanism.
I have written a guest post on the same for Subhankar.
Continue Reading at:
http://investmentsfordummieslikeme.blogspot.com/2011/05/how-to-use-options-as-hedge-guest-post.html

Sunday, May 15, 2011

Technicals for the Next Week

It was a sideways kind of week with the Nifty registering a fall of 0.1 pc. The kind of movement suggests that it is a pause before the continuation of the fall. Let us look at a few technical parameters.


1. 5476 is a key support level for this month. The Markets hit 5472 and then bounced back. Keep a close on 5472. If it sustains below this level, one ca go short.

2. 5624 is the 200 EMA and 5754 is the 200 DMA. Longs only above 5624.

3. The biggest sign that this is a new impulsive downtrend for me is that it took 9 sessions to fall from 5912 to 5444. Its taken 6 sessions to reach a high of 5605 and we have not even retraced 38 pc of the fall. This makes it clear to me that this is a pause before further fall.

4. The Bollinger Bands are opening up indicating a further fall. The support currently comes at 5393.


5. The various channels are marked on the chart. 5451 is a key support breaking which the multi-month channel gets broken. The height of the channel is about 500 points which gives us a target of 4900-4950 points.

Summary:
Longs on close above 5624. Shorts if sustains below 5472. In between go long at around 5510 with stop loss at 5472 and short at around 5600 with stop loss at 5624.
The range of about 130 points should break soon giving targets of 5750 or 5350 both key levels. One is the previous bottom and the other is the 200 MA. The Range for this expiry should 5350-5750.