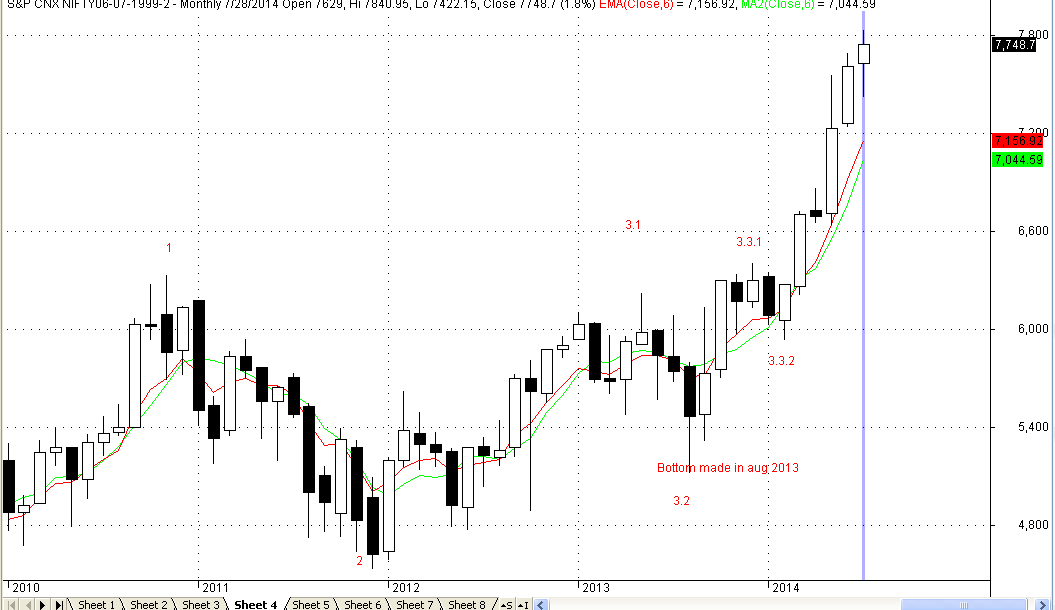
Today on a holiday, let us step back and look at the Long Term Elliot Wave picture. In the day to day and weekly hustle bustle, the big picture is often lost and it is only the big picture which counts and nothing else.
I tried to count the wave structure from the bottom made in October 2008 and re-tested in March 2009.
This post is dedicated to Ralph Elliot, the father of Elliot Waves (Born 28th July 1871)
http://en.wikipedia.org/wiki/Ralph_Nelson_Elliott
Wave 1 was from 2253 to 6338 constituting 4085 points and lasting from October 2008 to November 2010. It tested the previous top at 6358.
Wave 2 was down from 6338 to 4531 constituting 1807 points, about 44 pc of the previous rise. It lasted from November 2010 to December 2011.
Wave 3 started in December 2011 at 4531
Wave 3.1 UP 4531 - 6229 in May 2013 (1698 points)
Wave 3.2 DOWN 6229- 5118 in August 2013 (711 points - 42 pc retracement)
Wave 3.3.1 UP 5118 - 6415 in December 2013 (1297 points)
Wave 3.3.2 DOWN 6415 - 5933 in February 2014 (482 points - 37 pc retracement)
Wave 3.3.3 commenced in February 2014 and has targets of 7631, 8680 or 10378
Wave 3 has traversed about 1908 points from 5933. depending on where it ends, the broader targets for Nifty could be around 10400-12000 points.
Overall, the top should be made sometime around November 2015 - Feb 2016 period as per the famous 8 year cycle, where every 8 years a serious top is made.
The negation point for all this break of 6350, the previous multi year top.
Strategy for me is simple:
I have just bought and held the 10 stocks I shared with my friends as my core portfolio on June 30th.
I will take a call on liquidating them in November 2015, in the intermediate book profits and keep reducing cost of acquisition.
Elliot is not the holy grail of investing and should be used just as 1 of the aids for looking at the big picture.

I like the way you explain through charts about the topic that is related to Nifty Future Tips as it makes a trader understand easily.
ReplyDeleteDEAR SIR,
ReplyDeleteGEvng
Wave 3.2 DOWN 6229- 5118 in August 2013 (711 points - 42 pc retracement)
JUST CLARIFICATION : 1,111 PTS & 65.4%
ALSO U CAN HAVE UR ANALYSIS DAILY ON BNF AS THE MARGIN MONEY IS LESS IN COMPARISON WITH NF50. VALUABLE BLOG FOR THE TRADERS.
REGARDS